33
/
AIzaSyB4mHJ5NPEv-XzF7P6NDYXjlkCWaeKw5bc
November 30, 2025
249091
Sri Lanka
LKA
true
2
1
Net current transfers from abroad (constant LCU)
2003,2002,2001,2000,1999,1998,1997,1996
Create a timeline
Public Timelines
For education
For educational institutions
For teachers
For students
Cabinet
For educational institutions
For teachers
For students
Open cabinet
FAQ
Close
Create a timeline
Public timelines
FAQ
About & Feedback
Terms
Privacy
FAQ
Support 24/7
Cabinet
Get premium
Donate
Download
Global statistics library
→
Sri Lanka
→
Net current transfers from abroad (constant LCU)
This statistics in other country:
Albania
Algeria
Argentina
Armenia
Austria
Azerbaijan
Bahamas, The
Bangladesh
Barbados
Belarus
Belgium
Belize
Benin
Bhutan
Bolivia
Bosnia and Herzegovina
Botswana
Brazil
Bulgaria
Burkina Faso
Burundi
Cambodia
Cameroon
Canada
Central African Republic
Chad
Chile
China
Colombia
Comoros
Congo, Rep.
Costa Rica
Cote d'Ivoire
Croatia
Cyprus
Czech Republic
Denmark
Djibouti
Dominican Republic
Ecuador
Egypt, Arab Rep.
El Salvador
Eritrea
Estonia
Ethiopia
Finland
France
Gabon
Gambia, The
Germany
Ghana
Greece
Guatemala
Guinea
Honduras
Hungary
Iceland
Iran, Islamic Rep.
Ireland
Israel
Italy
Jamaica
Japan
Jordan
Kazakhstan
Kenya
Kyrgyz Republic
Lao PDR
Lebanon
Lesotho
Liberia
Luxembourg
Macedonia, FYR
Madagascar
Malawi
Mali
Mauritania
Mauritius
Mexico
Mongolia
Montenegro
Morocco
Mozambique
Namibia
Nepal
Netherlands
New Zealand
Nicaragua
Niger
Nigeria
Norway
Pakistan
Panama
Papua New Guinea
Paraguay
Peru
Philippines
Portugal
Romania
Russian Federation
Rwanda
Senegal
Serbia
Sierra Leone
Slovak Republic
South Africa
South Sudan
Spain
Sri Lanka
Sudan
Swaziland
Sweden
Switzerland
Syrian Arab Republic
Tajikistan
Tanzania
Thailand
Togo
Trinidad and Tobago
Turkey
Turkmenistan
Uganda
Ukraine
United Kingdom
United States
Uruguay
Uzbekistan
Venezuela, RB
West Bank and Gaza
Zambia
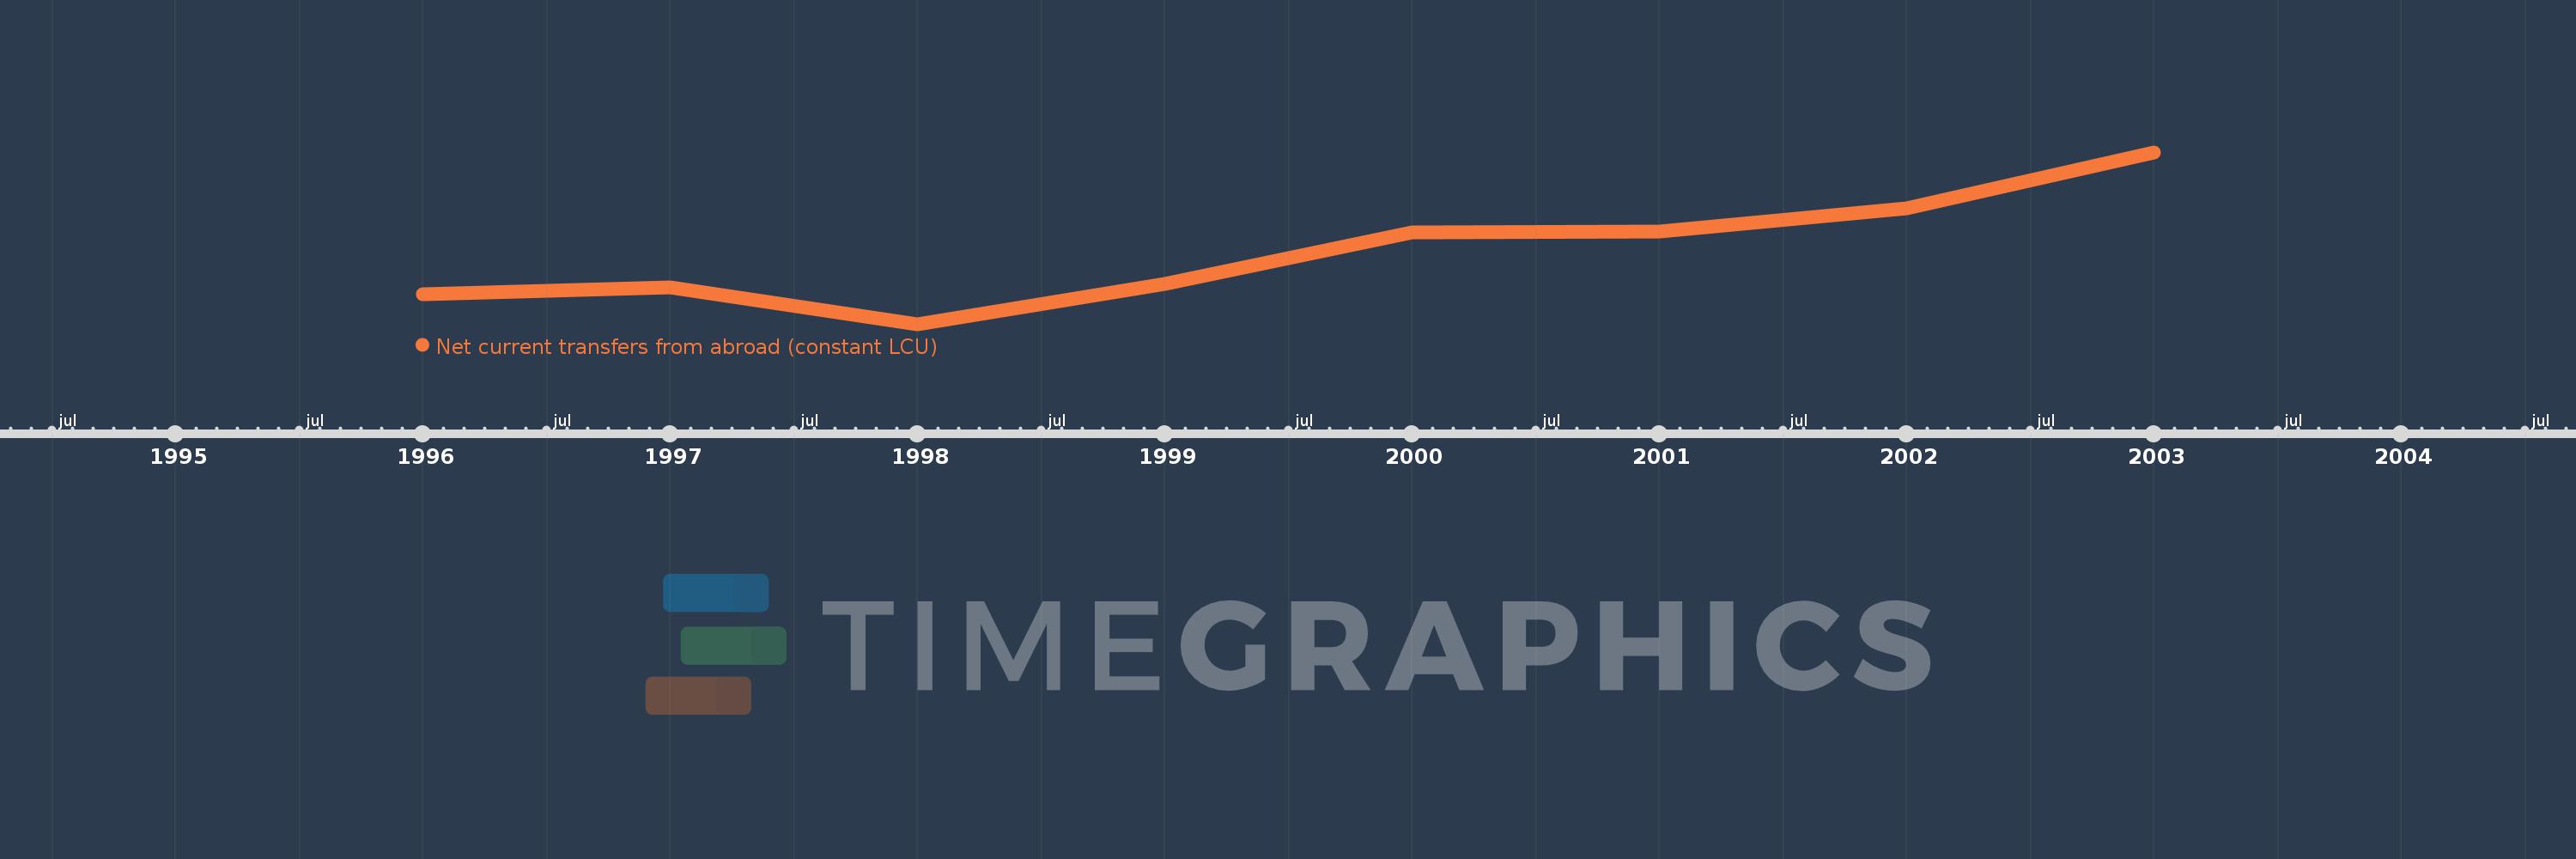
Timeline:
This timeline shows a graph from
1996
to
2003
of Sri Lanka. No data until
1995
. Number of actual observations by date:
8
.
Source name:
World Development Indicators
Source organization:
World Bank national accounts data, and OECD National Accounts data files.
Categories, topics:
Economy & Growth
Last updated:
apr 23, 2017
Indicators value changes by year
Meaning:
84.943 bln
Minimum:
70.335 bln
jan 1, 1998
Maximum:
104.981 bln
jan 1, 2003
At the date of observation
Value
Absolute change
Change from the previous value
jan 1, 1996
76.296 bln
+76.296 bln
0.0%
jan 1, 1997
77.847 bln
+1.55 bln
2.03%
jan 1, 1998
70.335 bln
-7.512 bln
-9.65%
jan 1, 1999
78.433 bln
+8.098 bln
11.51%
jan 1, 2000
88.809 bln
+10.376 bln
13.23%
jan 1, 2001
89.068 bln
+258.642 mln
0.29%
jan 1, 2002
93.773 bln
+4.705 bln
5.28%
jan 1, 2003
104.981 bln
+11.208 bln
11.95%
Ranking of countries by current statistics by years
About & Feedback
Terms
Privacy
FAQ
Support 24/7
Cabinet
Get premium
Donate
The service accepts bank transfer (ACH, Wire) or cards (Visa, MasterCard, etc). Processed by Stripe.
Secured with SSL