33
/
AIzaSyB4mHJ5NPEv-XzF7P6NDYXjlkCWaeKw5bc
November 30, 2025
186863
Malawi
MWI
true
2
1
Net current transfers from abroad (constant LCU)
2014,2013,2012,2011,2010,2009,2008,2007,2006,2005,2004
Create a timeline
Public Timelines
For education
For educational institutions
For teachers
For students
Cabinet
For educational institutions
For teachers
For students
Open cabinet
FAQ
Close
Create a timeline
Public timelines
FAQ
About & Feedback
Terms
Privacy
FAQ
Support 24/7
Cabinet
Get premium
Donate
Download
Global statistics library
→
Malawi
→
Net current transfers from abroad (constant LCU)
This statistics in other country:
Albania
Algeria
Argentina
Armenia
Austria
Azerbaijan
Bahamas, The
Bangladesh
Barbados
Belarus
Belgium
Belize
Benin
Bhutan
Bolivia
Bosnia and Herzegovina
Botswana
Brazil
Bulgaria
Burkina Faso
Burundi
Cambodia
Cameroon
Canada
Central African Republic
Chad
Chile
China
Colombia
Comoros
Congo, Rep.
Costa Rica
Cote d'Ivoire
Croatia
Cyprus
Czech Republic
Denmark
Djibouti
Dominican Republic
Ecuador
Egypt, Arab Rep.
El Salvador
Eritrea
Estonia
Ethiopia
Finland
France
Gabon
Gambia, The
Germany
Ghana
Greece
Guatemala
Guinea
Honduras
Hungary
Iceland
Iran, Islamic Rep.
Ireland
Israel
Italy
Jamaica
Japan
Jordan
Kazakhstan
Kenya
Kyrgyz Republic
Lao PDR
Lebanon
Lesotho
Liberia
Luxembourg
Macedonia, FYR
Madagascar
Malawi
Mali
Mauritania
Mauritius
Mexico
Mongolia
Montenegro
Morocco
Mozambique
Namibia
Nepal
Netherlands
New Zealand
Nicaragua
Niger
Nigeria
Norway
Pakistan
Panama
Papua New Guinea
Paraguay
Peru
Philippines
Portugal
Romania
Russian Federation
Rwanda
Senegal
Serbia
Sierra Leone
Slovak Republic
South Africa
South Sudan
Spain
Sri Lanka
Sudan
Swaziland
Sweden
Switzerland
Syrian Arab Republic
Tajikistan
Tanzania
Thailand
Togo
Trinidad and Tobago
Turkey
Turkmenistan
Uganda
Ukraine
United Kingdom
United States
Uruguay
Uzbekistan
Venezuela, RB
West Bank and Gaza
Zambia
Timeline:
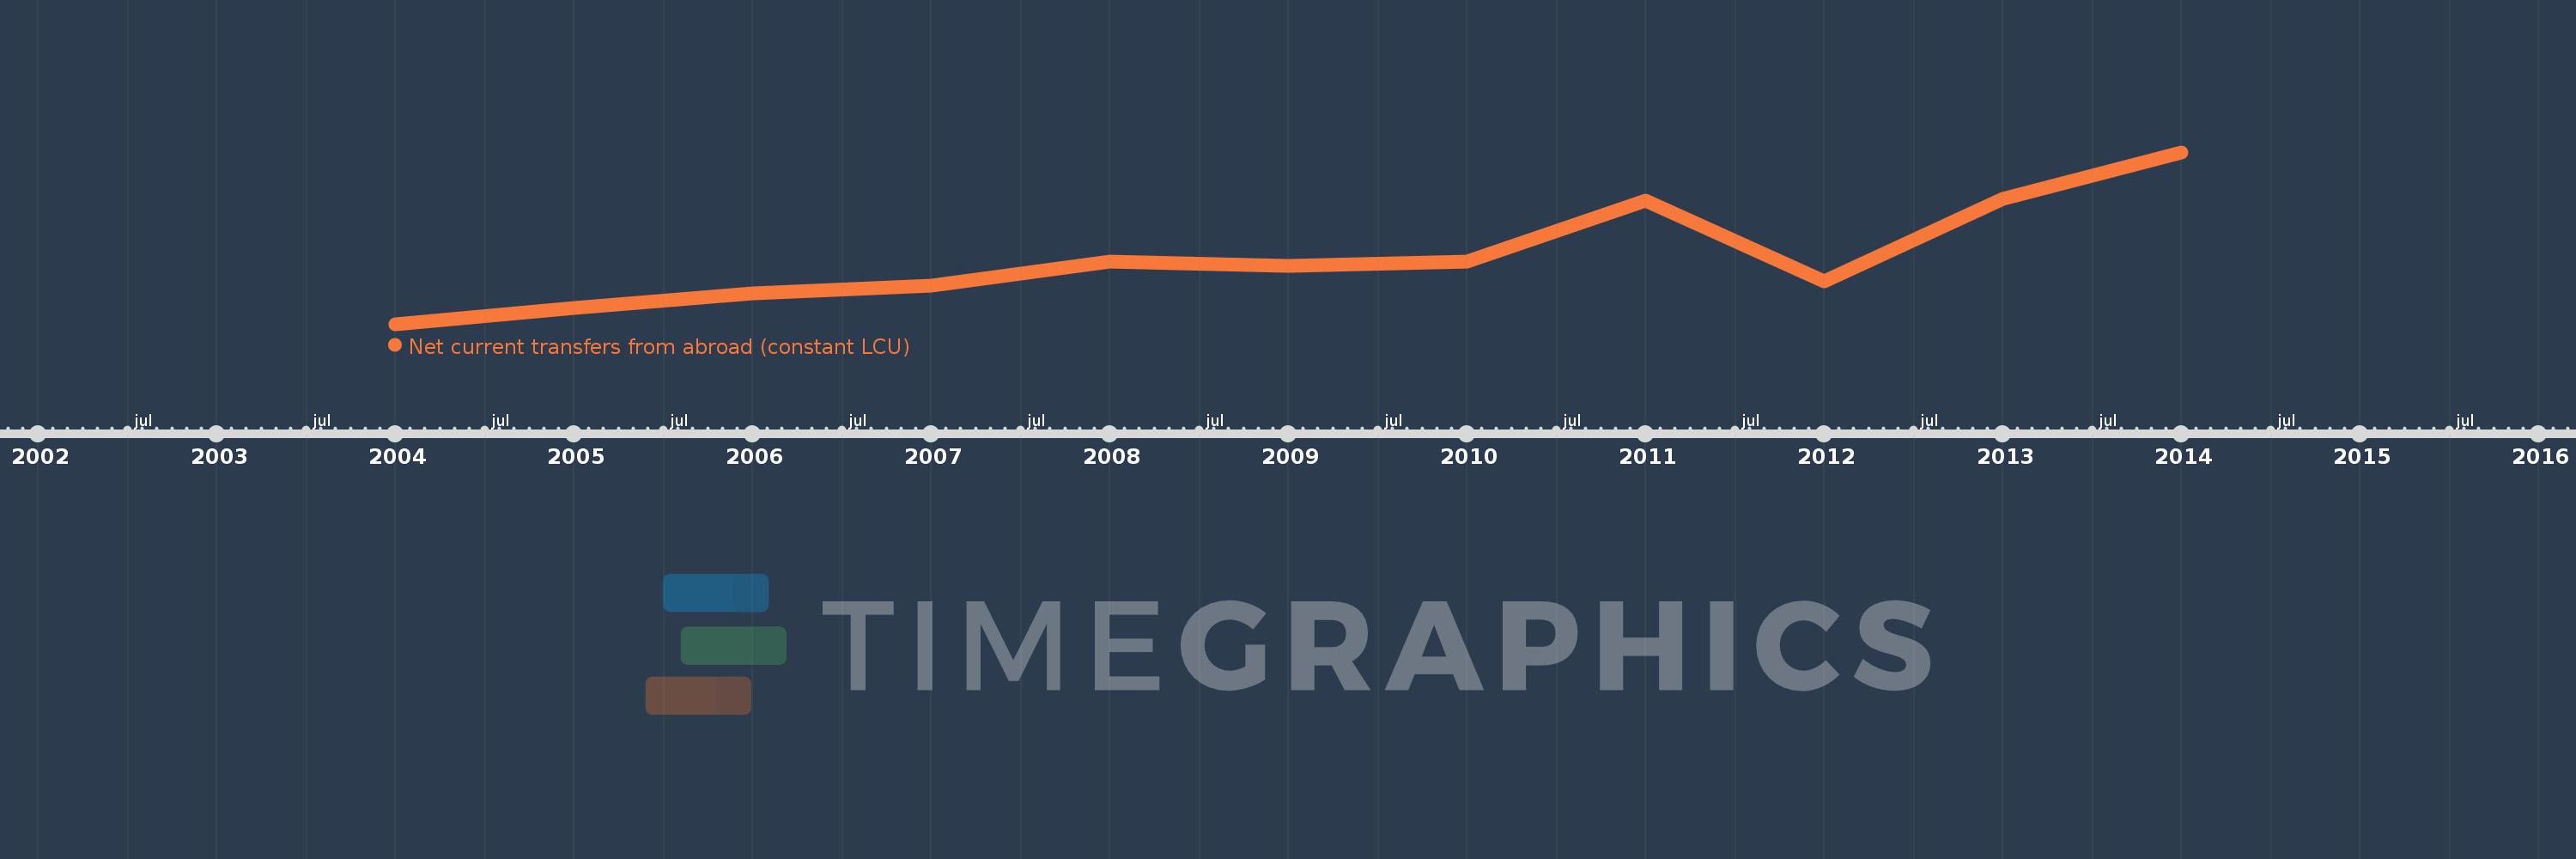
This timeline shows a graph from
2004
to
2014
of Malawi. No data until
2003
. Number of actual observations by date:
11
.
Source name:
World Development Indicators
Source organization:
World Bank national accounts data, and OECD National Accounts data files.
Categories, topics:
Economy & Growth
Last updated:
apr 23, 2017
Indicators value changes by year
Meaning:
105.856 bln
Minimum:
48.386 bln
jan 1, 2004
Maximum:
196.565 bln
jan 1, 2014
At the date of observation
Value
Absolute change
Change from the previous value
jan 1, 2004
48.386 bln
+48.386 bln
0.0%
jan 1, 2005
62.369 bln
+13.984 bln
28.9%
jan 1, 2006
74.652 bln
+12.282 bln
19.69%
jan 1, 2007
81.966 bln
+7.315 bln
9.8%
jan 1, 2008
102.113 bln
+20.147 bln
24.58%
jan 1, 2009
98.961 bln
-3.153 bln
-3.09%
jan 1, 2010
102.382 bln
+3.422 bln
3.46%
jan 1, 2011
154.97 bln
+52.587 bln
51.36%
jan 1, 2012
85.387 bln
-69.583 bln
-44.9%
jan 1, 2013
156.668 bln
+71.281 bln
83.48%
jan 1, 2014
196.565 bln
+39.897 bln
25.47%
Ranking of countries by current statistics by years
About & Feedback
Terms
Privacy
FAQ
Support 24/7
Cabinet
Get premium
Donate
The service accepts bank transfer (ACH, Wire) or cards (Visa, MasterCard, etc). Processed by Stripe.
Secured with SSL