Download This statistics in other country:
Timeline:
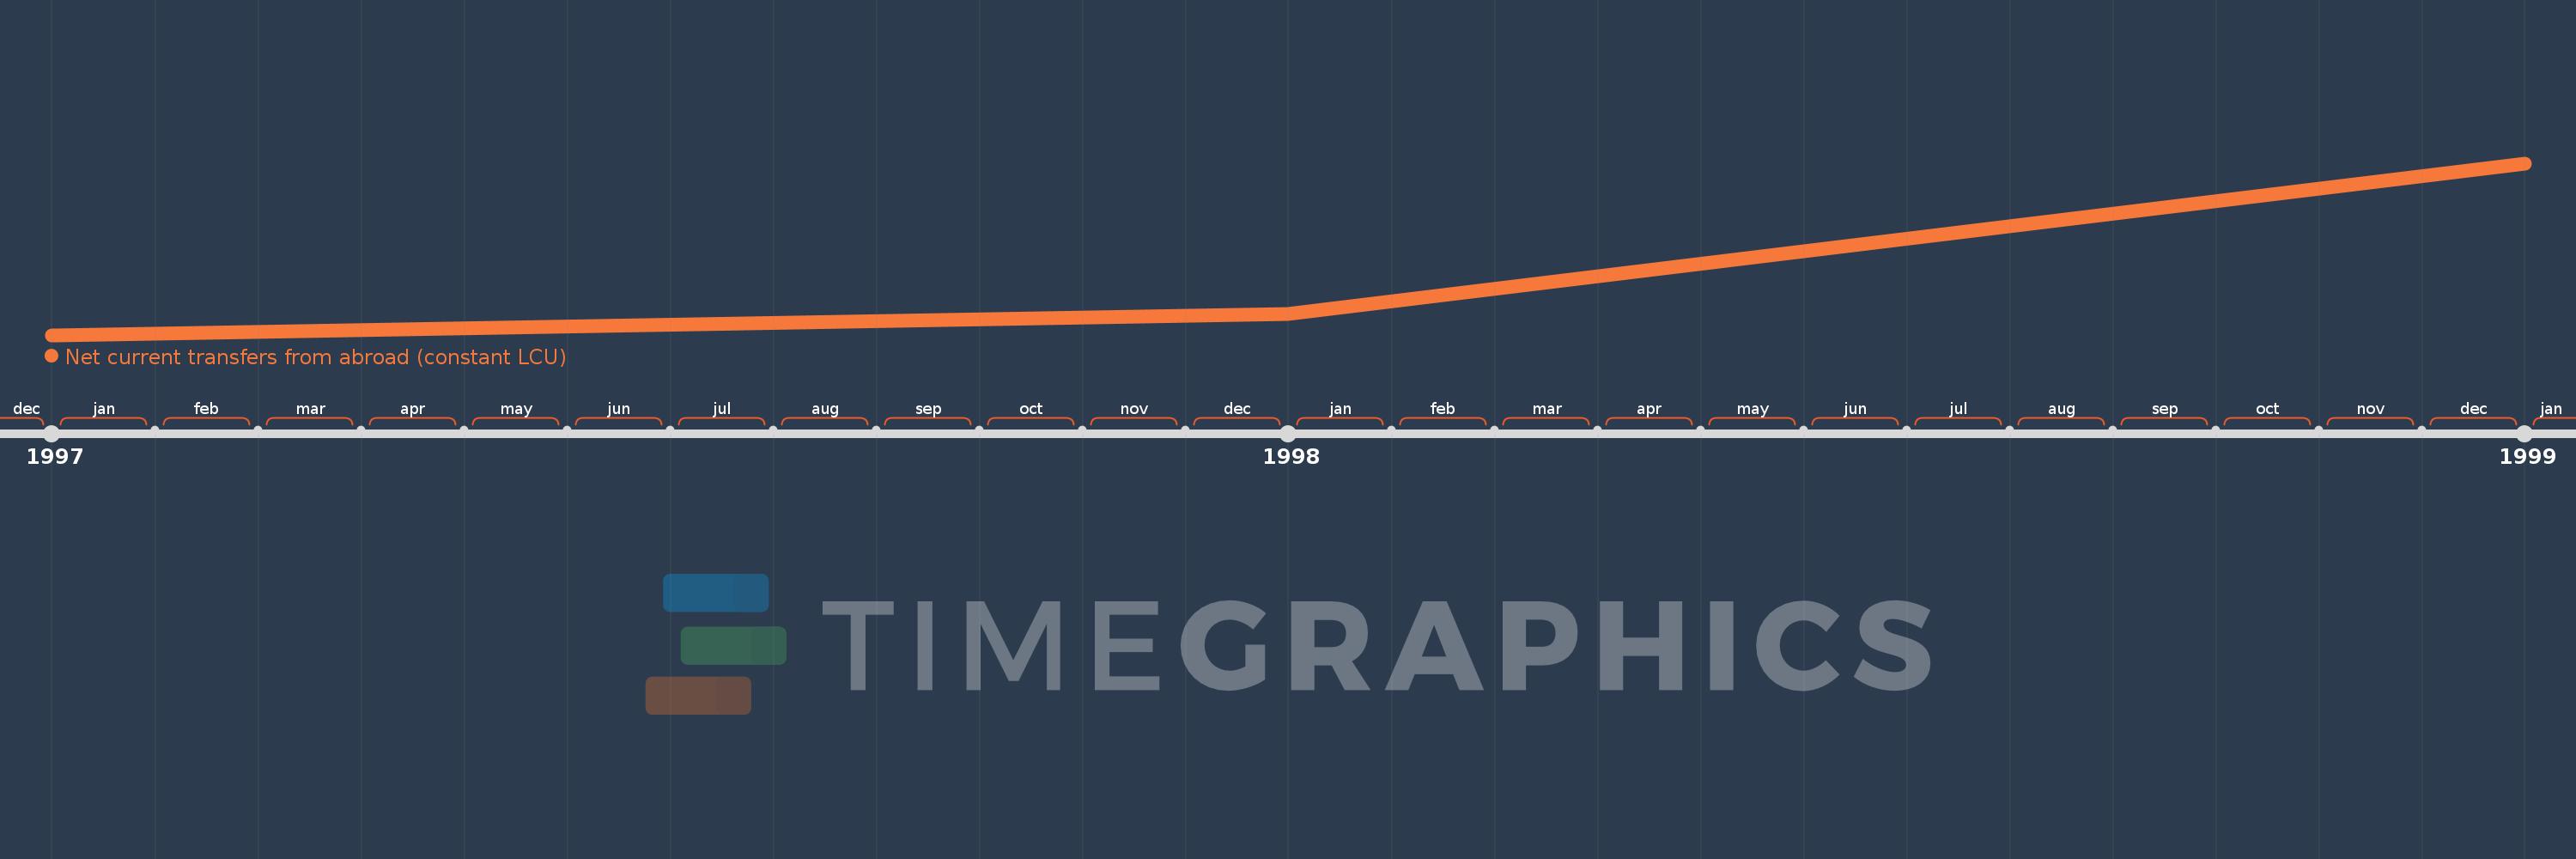
This timeline shows a graph from 1997 to 1999 of Israel. No data until 1996. Number of actual observations by date: 3.
Source name:
World Development Indicators
Source organization:
World Bank national accounts data, and OECD National Accounts data files.
Categories, topics:
Economy & Growth
Last updated:
apr 23, 2017
Indicators value changes by year
Minimum:
26.934 bln
jan 1, 1997
Maximum:
27.641 bln
jan 1, 1999
At the date of observation
Value
Absolute change
Change from the previous value
jan 1, 1997
26.934 bln
+26.934 bln
0.0%
jan 1, 1998
27.022 bln
+87.644 mln
0.33%
jan 1, 1999
27.641 bln
+618.989 mln
2.29%
Ranking of countries by current statistics by years