Download This statistics in other country:
Timeline:
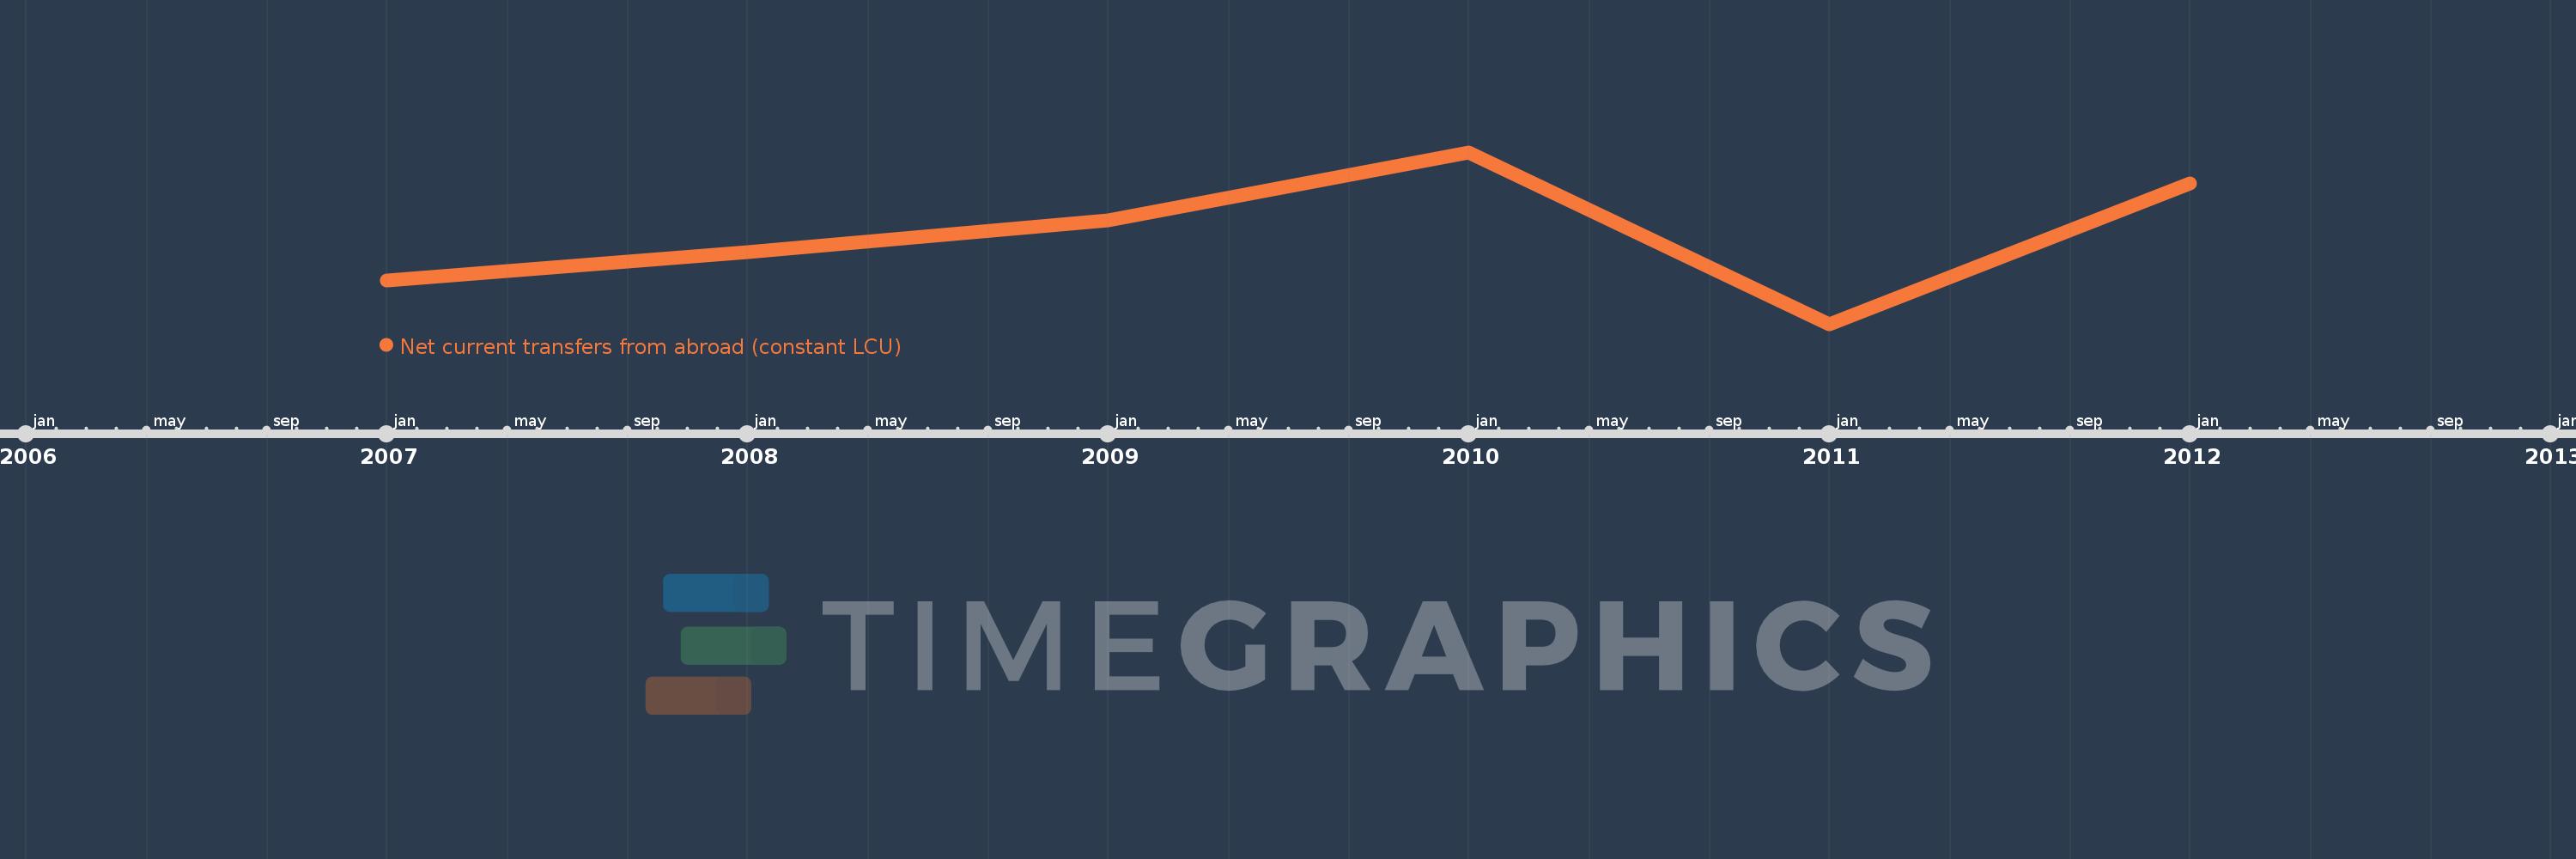
This timeline shows a graph from 2007 to 2012 of Ghana. No data until 2006. Number of actual observations by date: 6.
Source name:
World Development Indicators
Source organization:
World Bank national accounts data, and OECD National Accounts data files.
Categories, topics:
Economy & Growth
Last updated:
apr 23, 2017
Indicators value changes by year
Minimum:
1.72 bln
jan 1, 2011
Maximum:
2.3 bln
jan 1, 2010
At the date of observation
Value
Absolute change
Change from the previous value
jan 1, 2007
1.867 bln
+1.867 bln
0.0%
jan 1, 2008
1.964 bln
+96.3 mln
5.16%
jan 1, 2009
2.069 bln
+105.848 mln
5.39%
jan 1, 2010
2.3 bln
+230.753 mln
11.15%
jan 1, 2011
1.72 bln
-579.895 mln
-25.21%
jan 1, 2012
2.197 bln
+476.383 mln
27.69%
Ranking of countries by current statistics by years