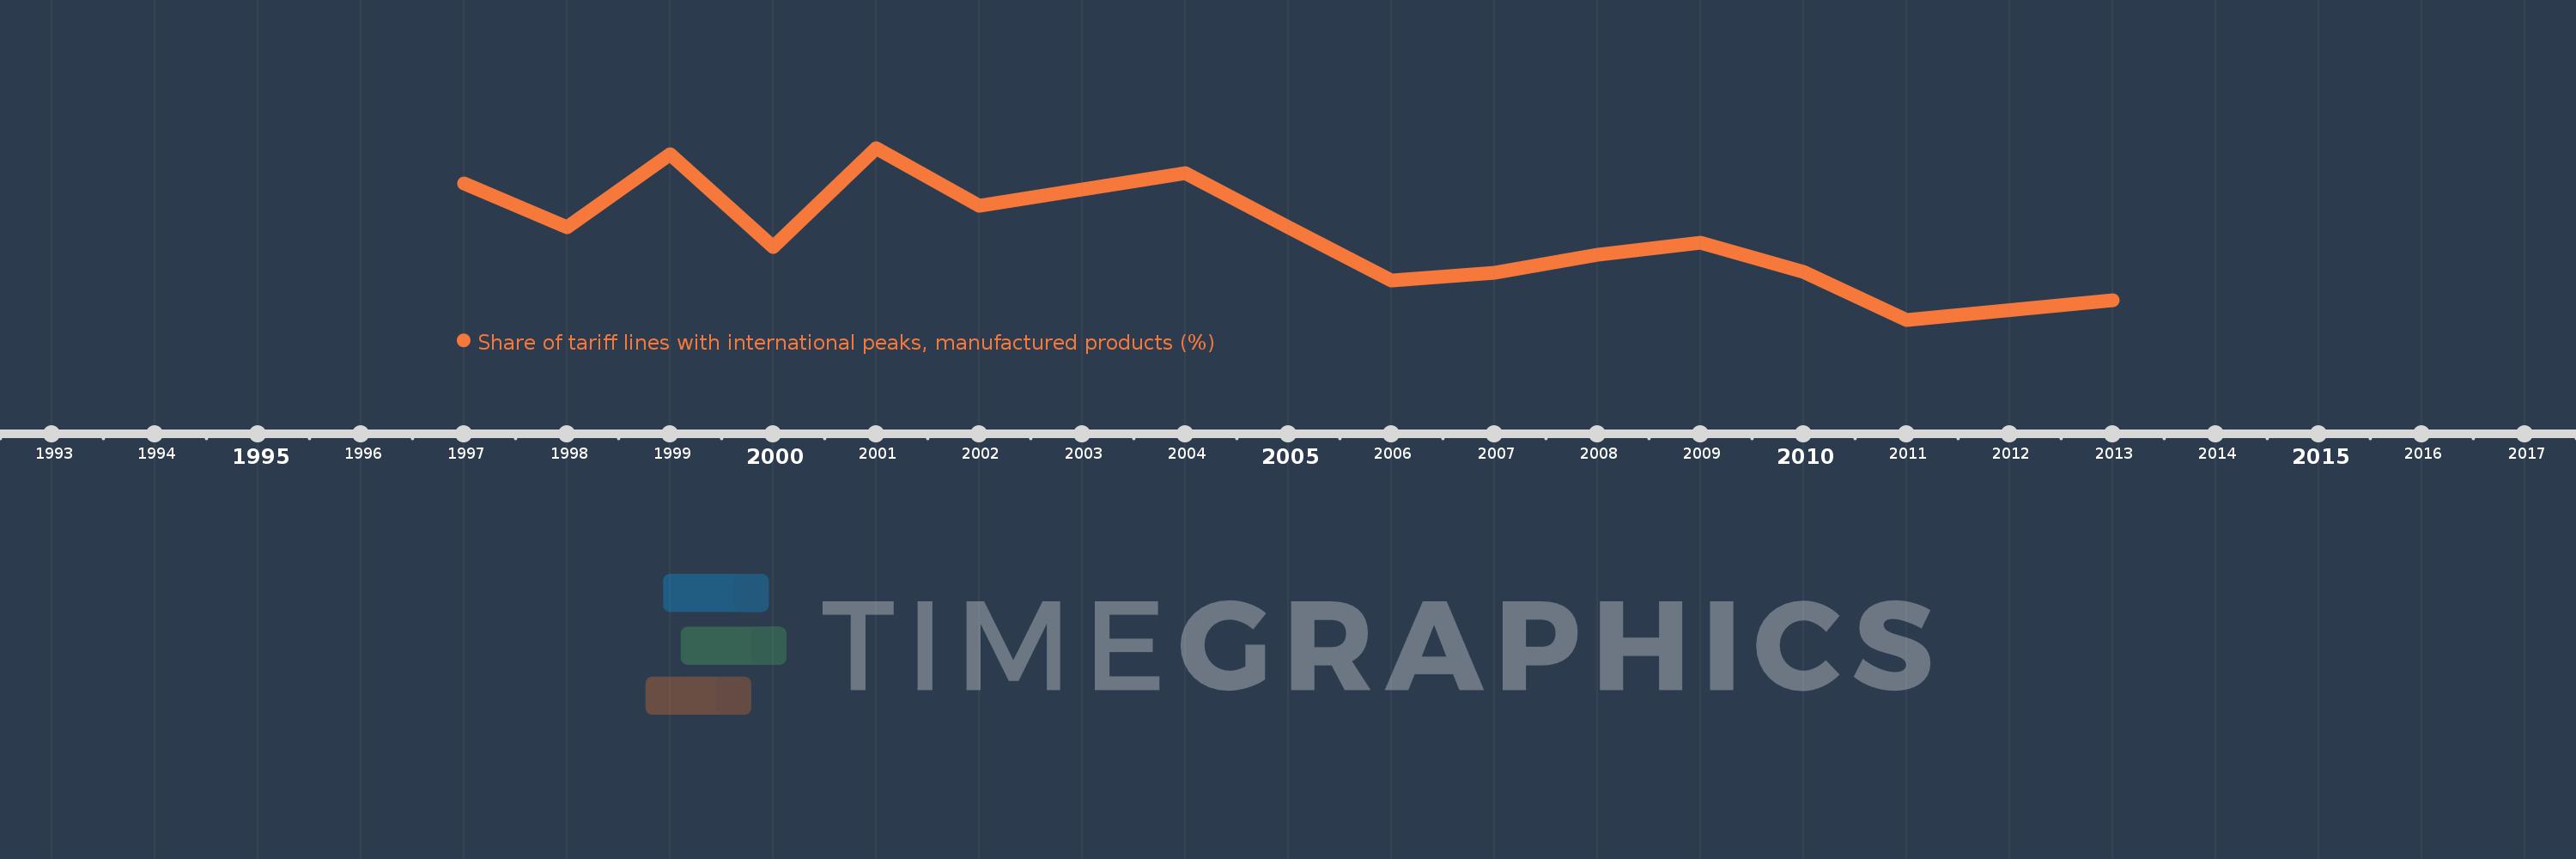
This timeline shows a graph from 1997 to 2013 of Upper middle income. No data until 1996. Number of actual observations by date: 16.
Source name:
World Development Indicators
Source organization:
World Bank staff estimates using the World Integrated Trade Solution system, based on data from United Nations Conference on Trade and Development's Trade Analysis and Information System (TRAINS) database.
Categories, topics:
Private Sector, Trade
Last updated:
apr 23, 2017
Indicators value changes by year
Meaning:
25.968
Minimum:
13.498
jan 1, 2011
Maximum:
37.649
jan 1, 2001
At the date of observation
Value
Absolute change
Change from the previous value
jan 1, 1997
32.717
+32.717
0.0%
jan 1, 1998
26.537
-6.18
-18.89%
jan 1, 1999
36.756
+10.22
38.51%
jan 1, 2000
23.764
-12.993
-35.35%
jan 1, 2001
37.649
+13.886
58.43%
jan 1, 2002
29.491
-8.158
-21.67%
jan 1, 2003
31.784
+2.292
7.77%
jan 1, 2004
34.116
+2.332
7.34%
jan 1, 2005
26.523
-7.593
-22.26%
jan 1, 2006
18.971
-7.552
-28.47%
jan 1, 2007
20.15
+1.179
6.22%
jan 1, 2008
22.658
+2.508
12.45%
jan 1, 2009
24.305
+1.647
7.27%
jan 1, 2010
20.281
-4.024
-16.56%
jan 1, 2011
13.498
-6.783
-33.44%
jan 1, 2013
16.295
+2.797
20.72%
Ranking of countries by current statistics by years