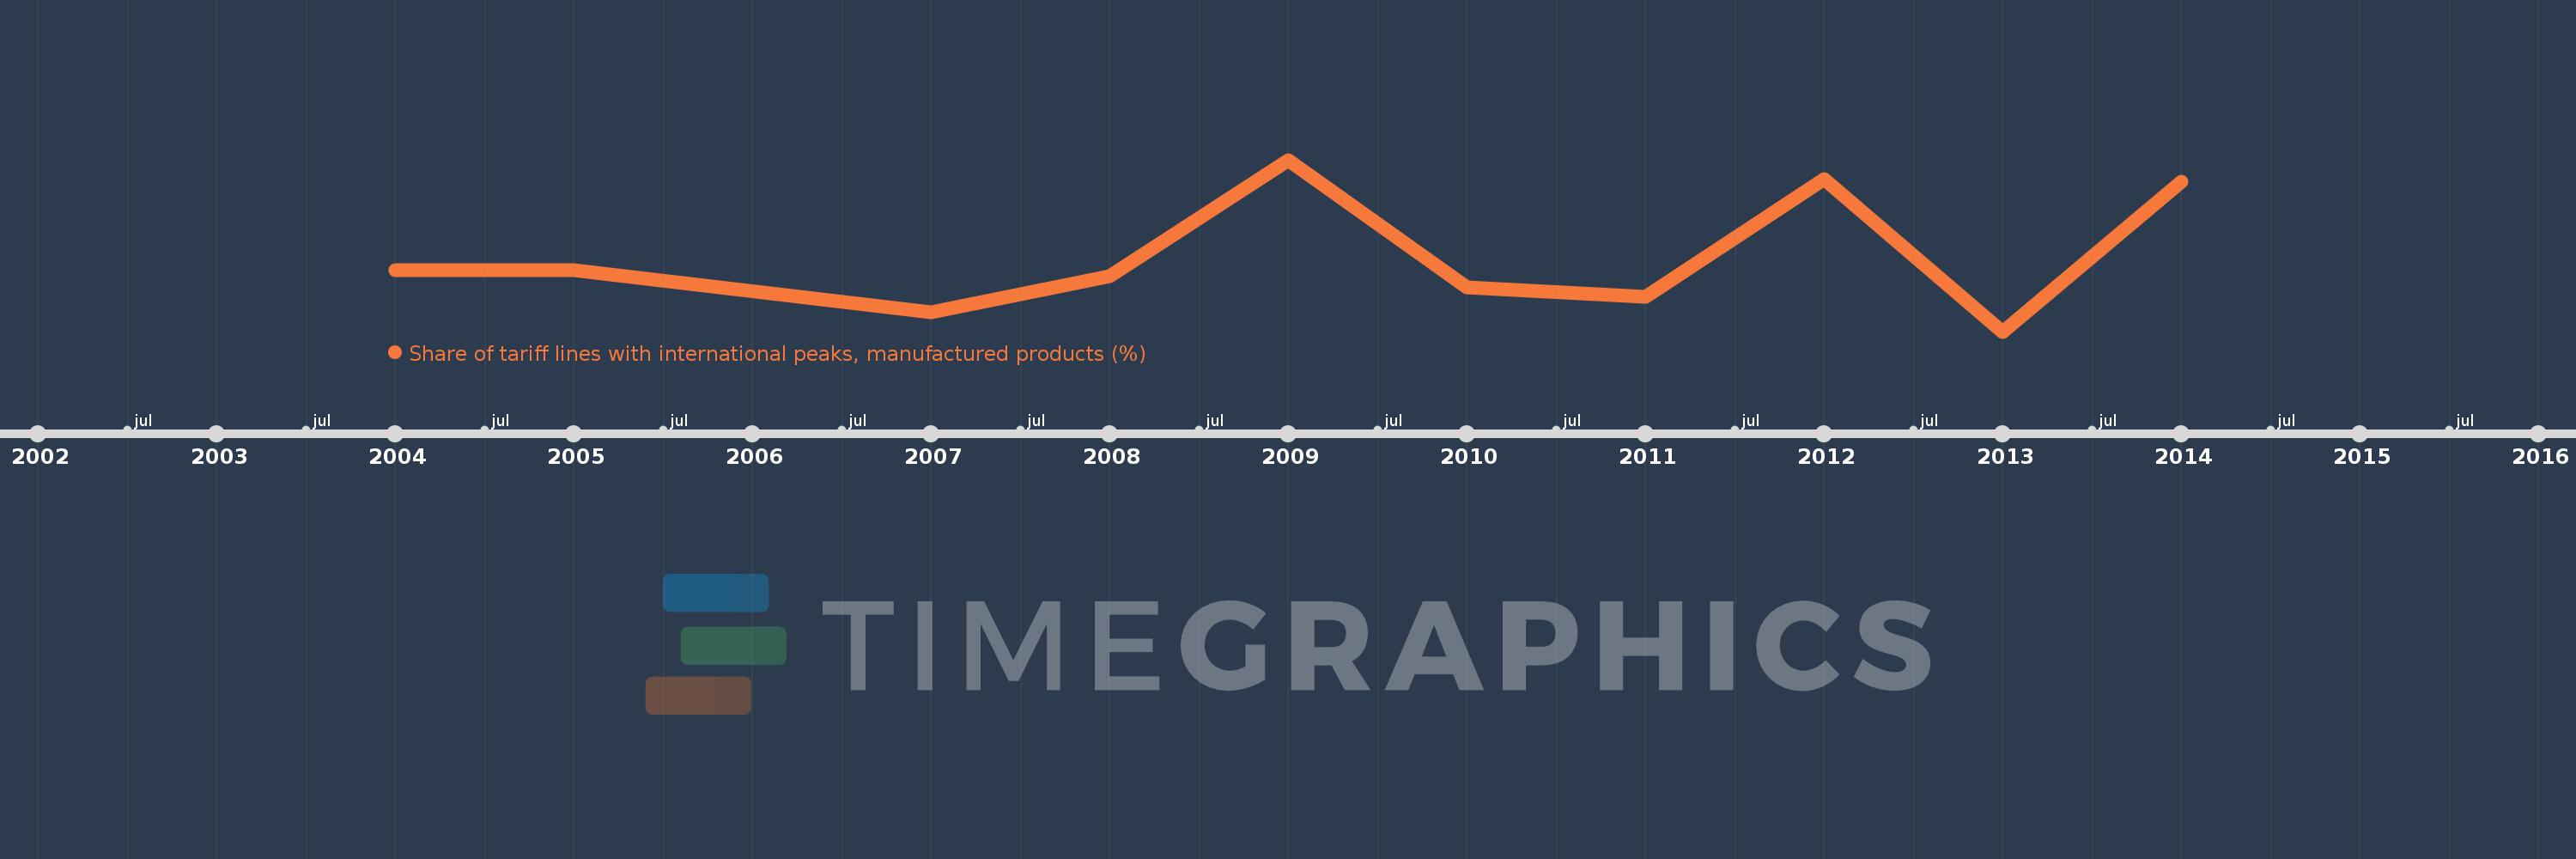
This timeline shows a graph from 2004 to 2014 of Fiji. No data until 2003. Number of actual observations by date: 10.
Source name:
World Development Indicators
Source organization:
World Bank staff estimates using the World Integrated Trade Solution system, based on data from United Nations Conference on Trade and Development's Trade Analysis and Information System (TRAINS) database.
Categories, topics:
Private Sector, Trade
Last updated:
apr 23, 2017
Indicators value changes by year
Meaning:
28.342
Minimum:
18.294
jan 1, 2013
Maximum:
41.304
jan 1, 2009
At the date of observation
Value
Absolute change
Change from the previous value
jan 1, 2004
26.528
+26.528
0.0%
jan 1, 2005
26.476
-0.051
-0.19%
jan 1, 2007
20.92
-5.556
-20.99%
jan 1, 2008
25.666
+4.746
22.69%
jan 1, 2009
41.304
+15.637
60.93%
jan 1, 2010
24.171
-17.133
-41.48%
jan 1, 2011
22.976
-1.195
-4.94%
jan 1, 2012
38.714
+15.738
68.5%
jan 1, 2013
18.294
-20.42
-52.75%
jan 1, 2014
38.375
+20.081
109.77%
Ranking of countries by current statistics by years