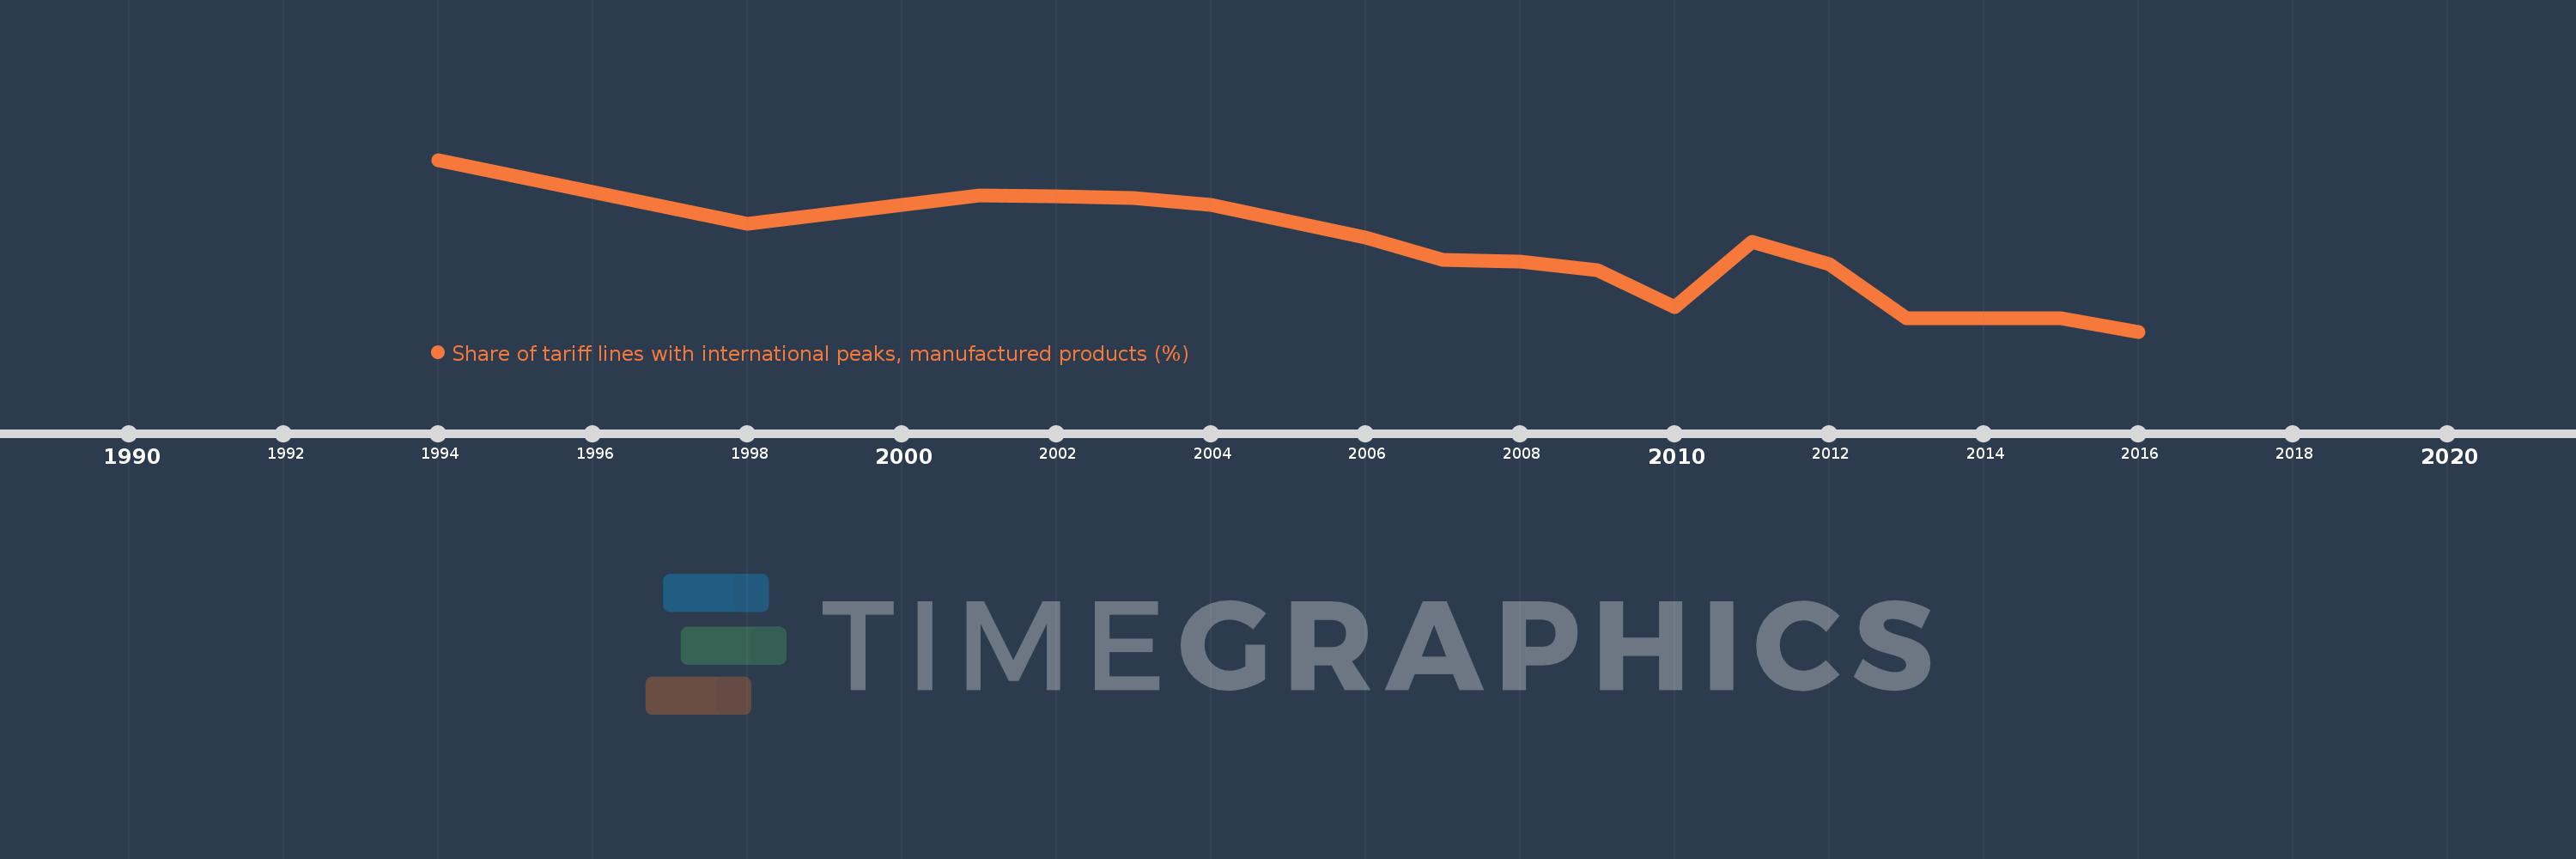
This timeline shows a graph from 1994 to 2016 of Morocco. No data until 1993. Number of actual observations by date: 16.
Source name:
World Development Indicators
Source organization:
World Bank staff estimates using the World Integrated Trade Solution system, based on data from United Nations Conference on Trade and Development's Trade Analysis and Information System (TRAINS) database.
Categories, topics:
Private Sector, Trade
Last updated:
apr 23, 2017
Indicators value changes by year
Meaning:
50.745
Minimum:
8.091
jan 1, 2016
Maximum:
97.2
jan 1, 1994
At the date of observation
Value
Absolute change
Change from the previous value
jan 1, 1994
97.2
+97.2
0.0%
jan 1, 1998
63.977
-33.223
-34.18%
jan 1, 2001
78.575
+14.598
22.82%
jan 1, 2002
78.391
-0.184
-0.23%
jan 1, 2003
77.385
-1.006
-1.28%
jan 1, 2004
73.773
-3.612
-4.67%
jan 1, 2006
56.945
-16.829
-22.81%
jan 1, 2007
45.358
-11.587
-20.35%
jan 1, 2008
44.27
-1.087
-2.4%
jan 1, 2009
39.838
-4.432
-10.01%
jan 1, 2010
20.781
-19.057
-47.84%
jan 1, 2011
54.645
+33.864
162.95%
jan 1, 2012
42.85
-11.795
-21.59%
jan 1, 2013
14.955
-27.895
-65.1%
jan 1, 2015
14.876
-0.079
-0.53%
jan 1, 2016
8.091
-6.785
-45.61%
Ranking of countries by current statistics by years