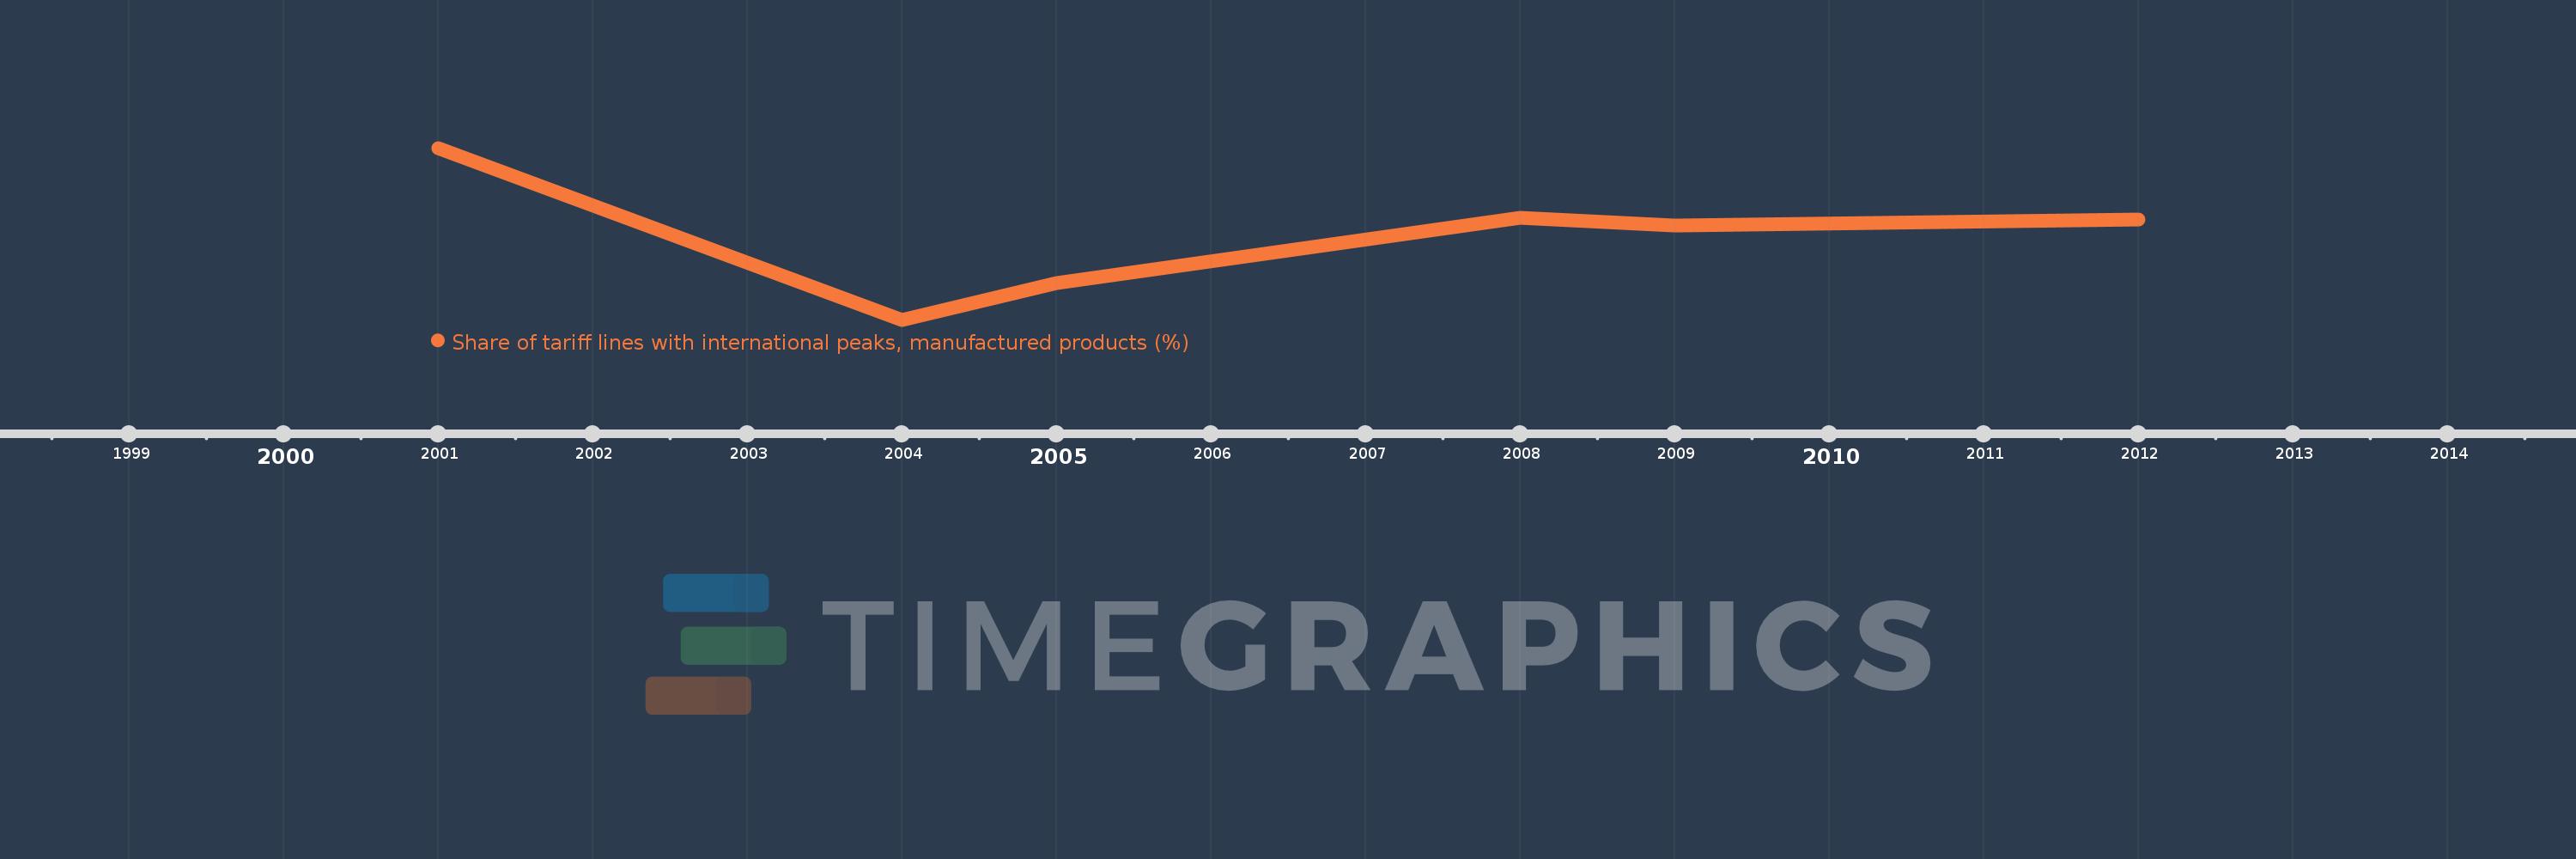
This timeline shows a graph from 2001 to 2012 of Iran, Islamic Rep.. No data until 2000. Number of actual observations by date: 6.
Source name:
World Development Indicators
Source organization:
World Bank staff estimates using the World Integrated Trade Solution system, based on data from United Nations Conference on Trade and Development's Trade Analysis and Information System (TRAINS) database.
Categories, topics:
Private Sector, Trade
Last updated:
apr 23, 2017
Indicators value changes by year
Meaning:
52.519
Minimum:
38.512
jan 1, 2004
Maximum:
67.092
jan 1, 2001
At the date of observation
Value
Absolute change
Change from the previous value
jan 1, 2001
67.092
+67.092
0.0%
jan 1, 2004
38.512
-28.579
-42.6%
jan 1, 2005
44.595
+6.083
15.79%
jan 1, 2008
55.537
+10.942
24.54%
jan 1, 2009
54.235
-1.302
-2.34%
jan 1, 2012
55.143
+0.909
1.68%
Ranking of countries by current statistics by years