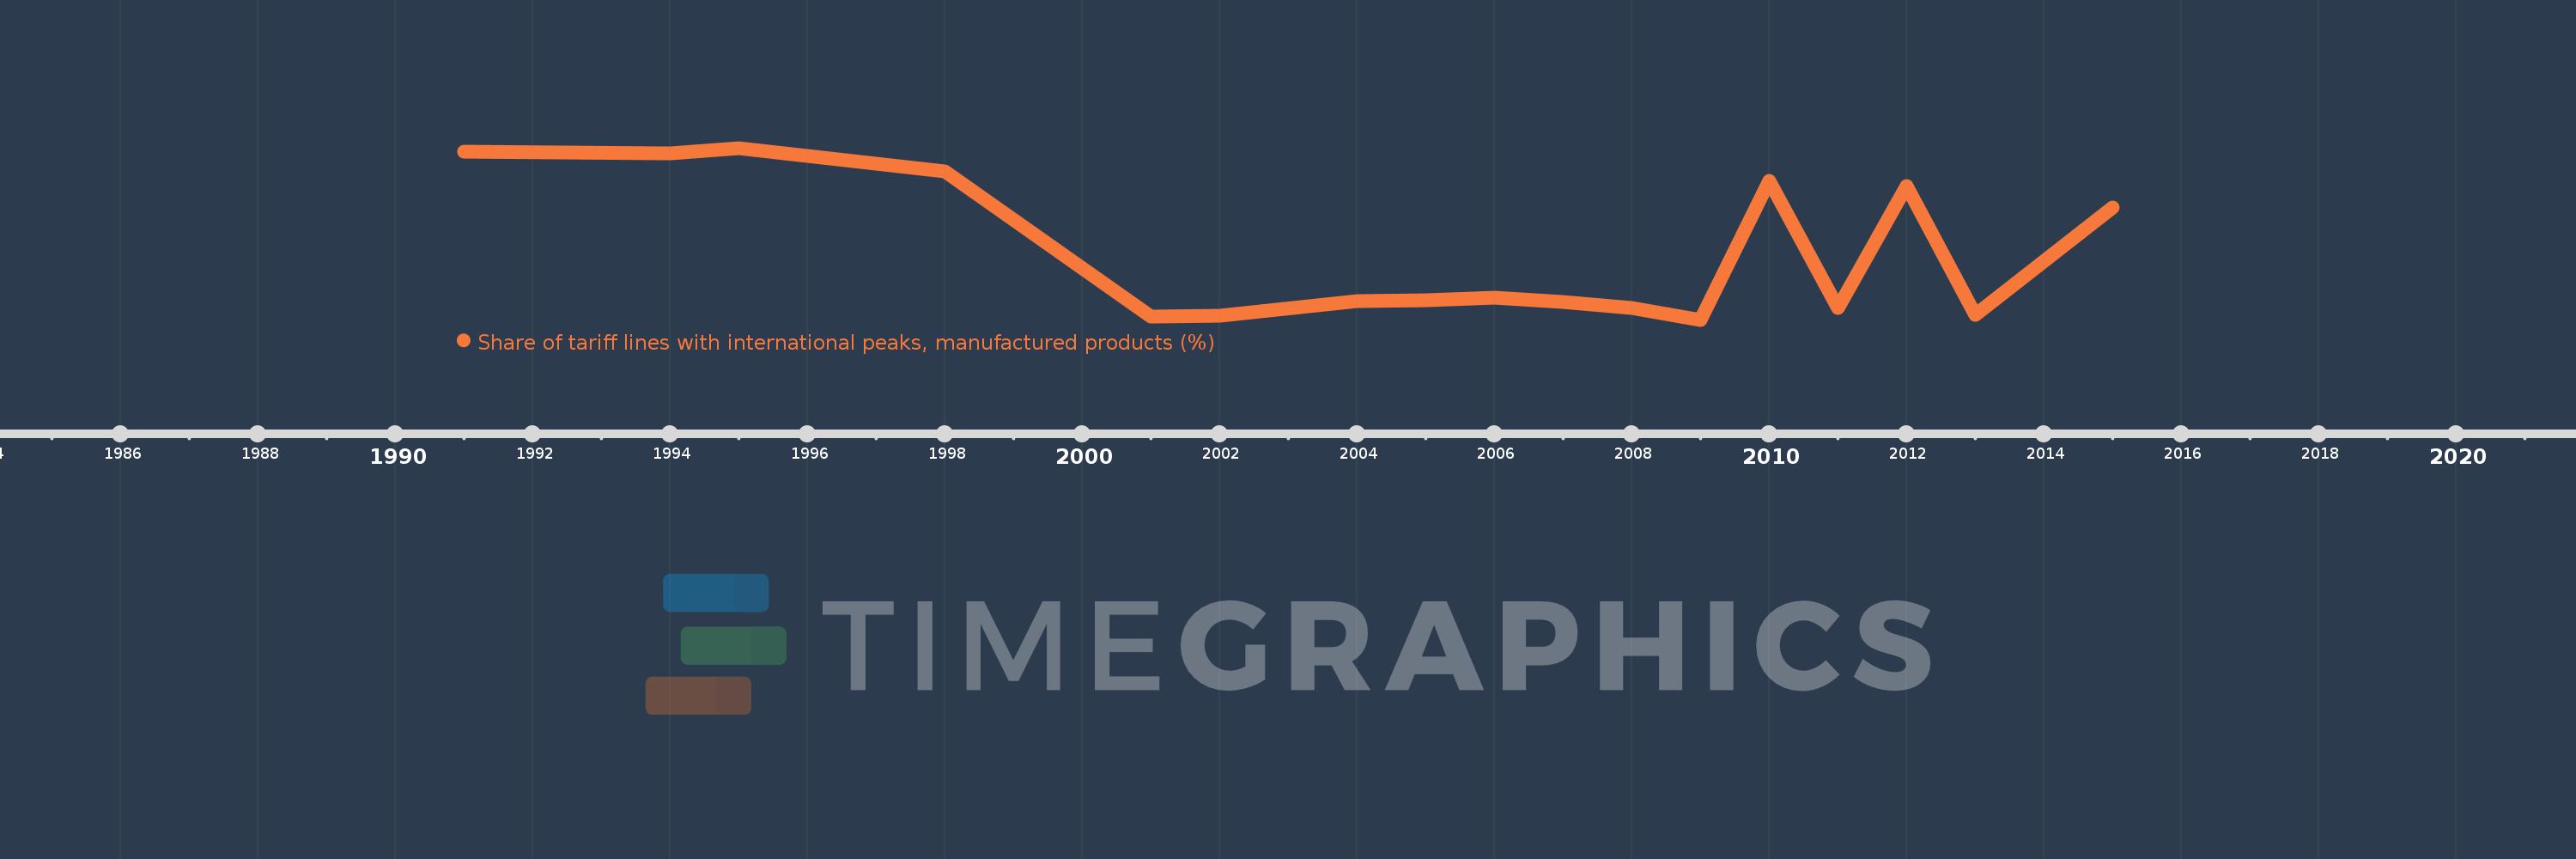
This timeline shows a graph from 1991 to 2015 of Sri Lanka. No data until 1990. Number of actual observations by date: 17.
Source name:
World Development Indicators
Source organization:
World Bank staff estimates using the World Integrated Trade Solution system, based on data from United Nations Conference on Trade and Development's Trade Analysis and Information System (TRAINS) database.
Categories, topics:
Private Sector, Trade
Last updated:
apr 23, 2017
Indicators value changes by year
Meaning:
31.146
Minimum:
18.965
jan 1, 2009
Maximum:
49.844
jan 1, 1995
At the date of observation
Value
Absolute change
Change from the previous value
jan 1, 1991
49.254
+49.254
0.0%
jan 1, 1994
48.948
-0.306
-0.62%
jan 1, 1995
49.844
+0.897
1.83%
jan 1, 1998
45.627
-4.217
-8.46%
jan 1, 2001
19.525
-26.102
-57.21%
jan 1, 2002
19.652
+0.127
0.65%
jan 1, 2004
22.286
+2.634
13.4%
jan 1, 2005
22.423
+0.137
0.62%
jan 1, 2006
22.91
+0.487
2.17%
jan 1, 2007
22.144
-0.767
-3.35%
jan 1, 2008
21.044
-1.099
-4.96%
jan 1, 2009
18.965
-2.079
-9.88%
jan 1, 2010
43.916
+24.95
131.56%
jan 1, 2011
21.009
-22.906
-52.16%
jan 1, 2012
43.071
+22.062
105.01%
jan 1, 2013
19.774
-23.297
-54.09%
jan 1, 2015
39.093
+19.319
97.7%
Ranking of countries by current statistics by years