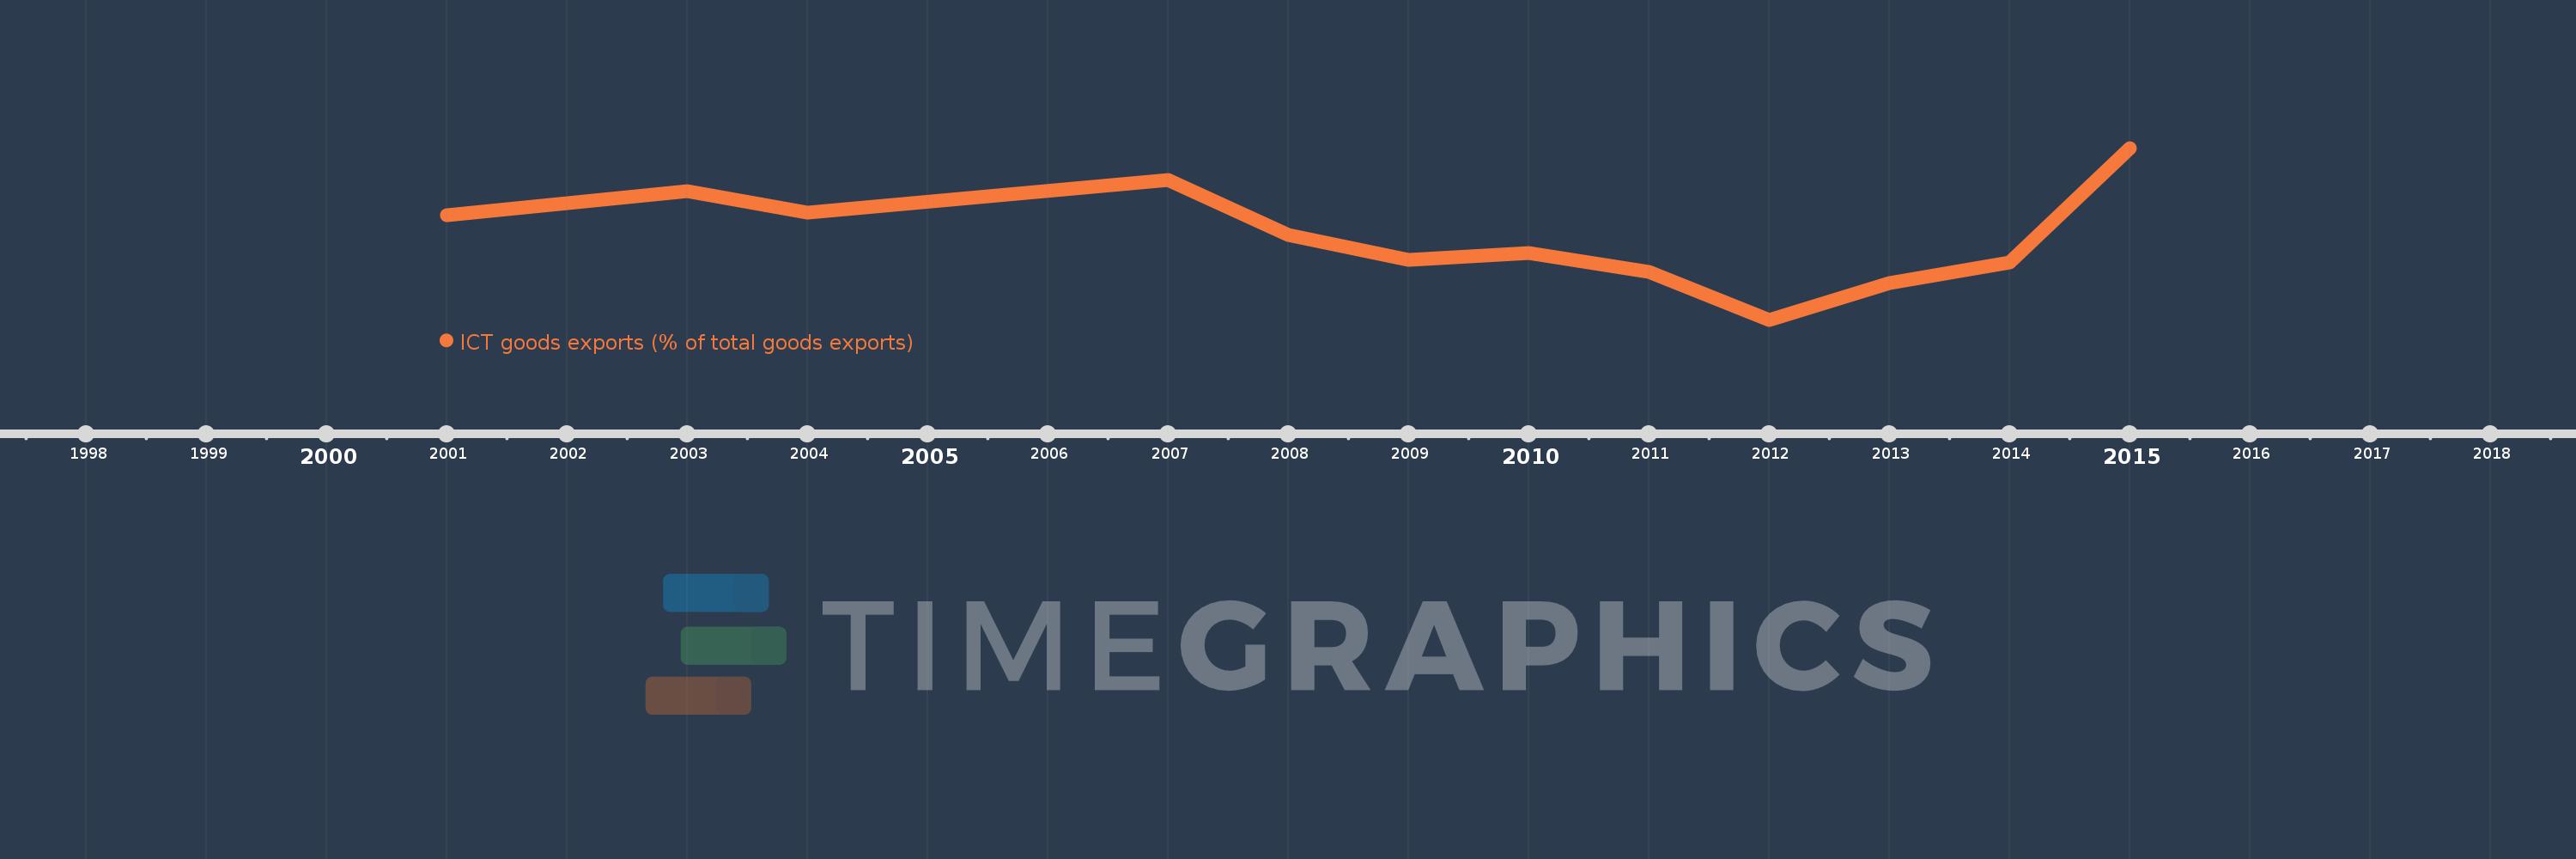
This timeline shows a graph from 2001 to 2015 of Sub-Saharan Africa (IDA & IBRD countries). No data until 2000. Number of actual observations by date: 13.
Source name:
World Development Indicators
Source organization:
United Nations Conference on Trade and Development's UNCTADstat database at http://unctadstat.unctad.org/ReportFolders/reportFolders.aspx.
Categories, topics:
Infrastructure, Private Sector, Trade
Last updated:
apr 23, 2017
Indicators value changes by year
Meaning:
0.596
Minimum:
0.43
jan 1, 2012
Maximum:
0.761
jan 1, 2015
At the date of observation
Value
Absolute change
Change from the previous value
jan 1, 2001
0.631
+0.631
0.0%
jan 1, 2002
0.655
+0.024
3.75%
jan 1, 2003
0.678
+0.024
3.61%
jan 1, 2004
0.637
-0.041
-6.01%
jan 1, 2007
0.7
+0.062
9.74%
jan 1, 2008
0.594
-0.106
-15.11%
jan 1, 2009
0.545
-0.049
-8.19%
jan 1, 2010
0.558
+0.013
2.39%
jan 1, 2011
0.522
-0.036
-6.52%
jan 1, 2012
0.43
-0.092
-17.56%
jan 1, 2013
0.5
+0.069
16.12%
jan 1, 2014
0.54
+0.04
8.02%
jan 1, 2015
0.761
+0.222
41.08%
Ranking of countries by current statistics by years