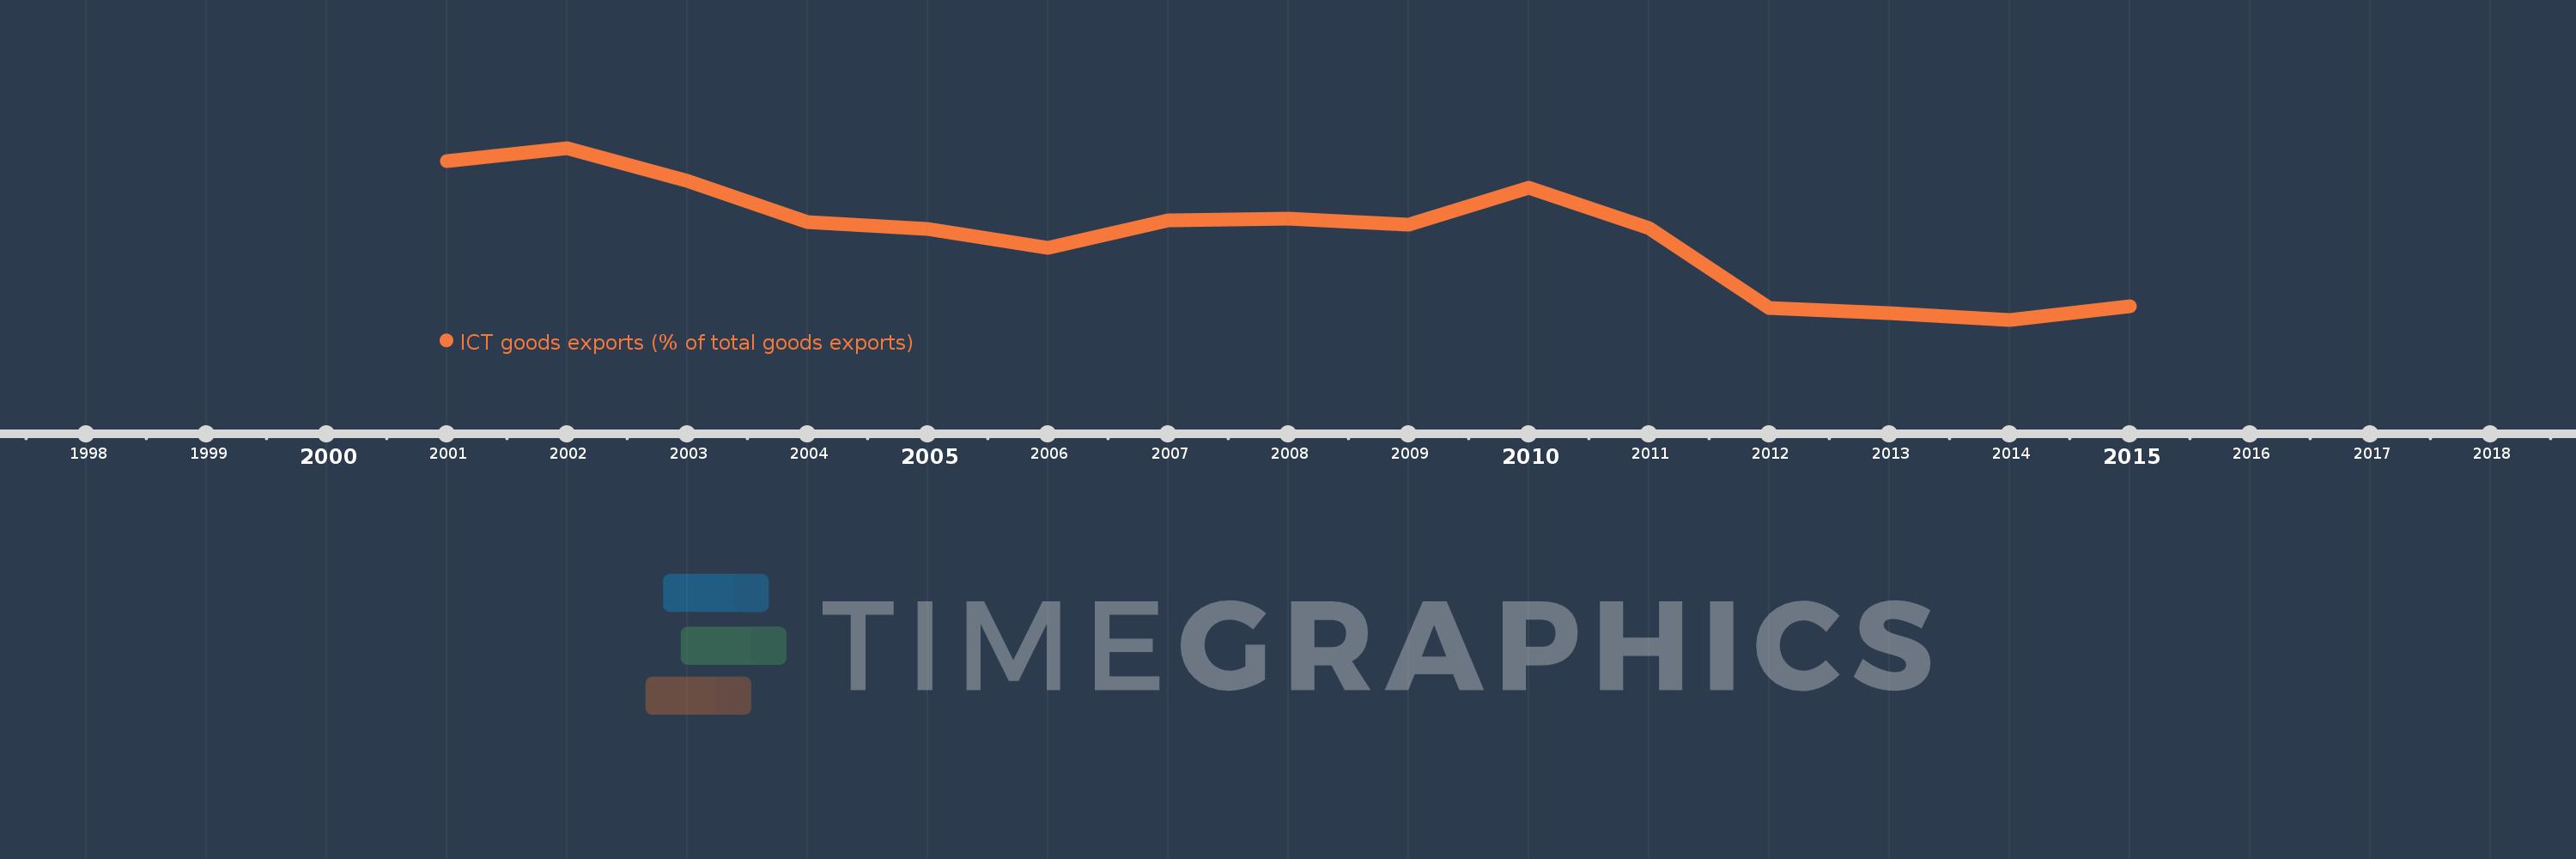
This timeline shows a graph from 2001 to 2015 of Latin America & Caribbean (excluding high income). No data until 2000. Number of actual observations by date: 15.
Source name:
World Development Indicators
Source organization:
United Nations Conference on Trade and Development's UNCTADstat database at http://unctadstat.unctad.org/ReportFolders/reportFolders.aspx.
Categories, topics:
Infrastructure, Private Sector, Trade
Last updated:
apr 23, 2017
Indicators value changes by year
Meaning:
8.151
Minimum:
6.762
jan 1, 2014
Maximum:
9.556
jan 1, 2002
At the date of observation
Value
Absolute change
Change from the previous value
jan 1, 2001
9.344
+9.344
0.0%
jan 1, 2002
9.556
+0.211
2.26%
jan 1, 2003
9.024
-0.532
-5.56%
jan 1, 2004
8.356
-0.668
-7.4%
jan 1, 2005
8.241
-0.115
-1.38%
jan 1, 2006
7.93
-0.311
-3.78%
jan 1, 2007
8.383
+0.453
5.72%
jan 1, 2008
8.404
+0.021
0.25%
jan 1, 2009
8.305
-0.099
-1.18%
jan 1, 2010
8.905
+0.599
7.22%
jan 1, 2011
8.258
-0.646
-7.26%
jan 1, 2012
6.947
-1.312
-15.88%
jan 1, 2013
6.865
-0.082
-1.17%
jan 1, 2014
6.762
-0.103
-1.5%
jan 1, 2015
6.985
+0.223
3.29%
Ranking of countries by current statistics by years