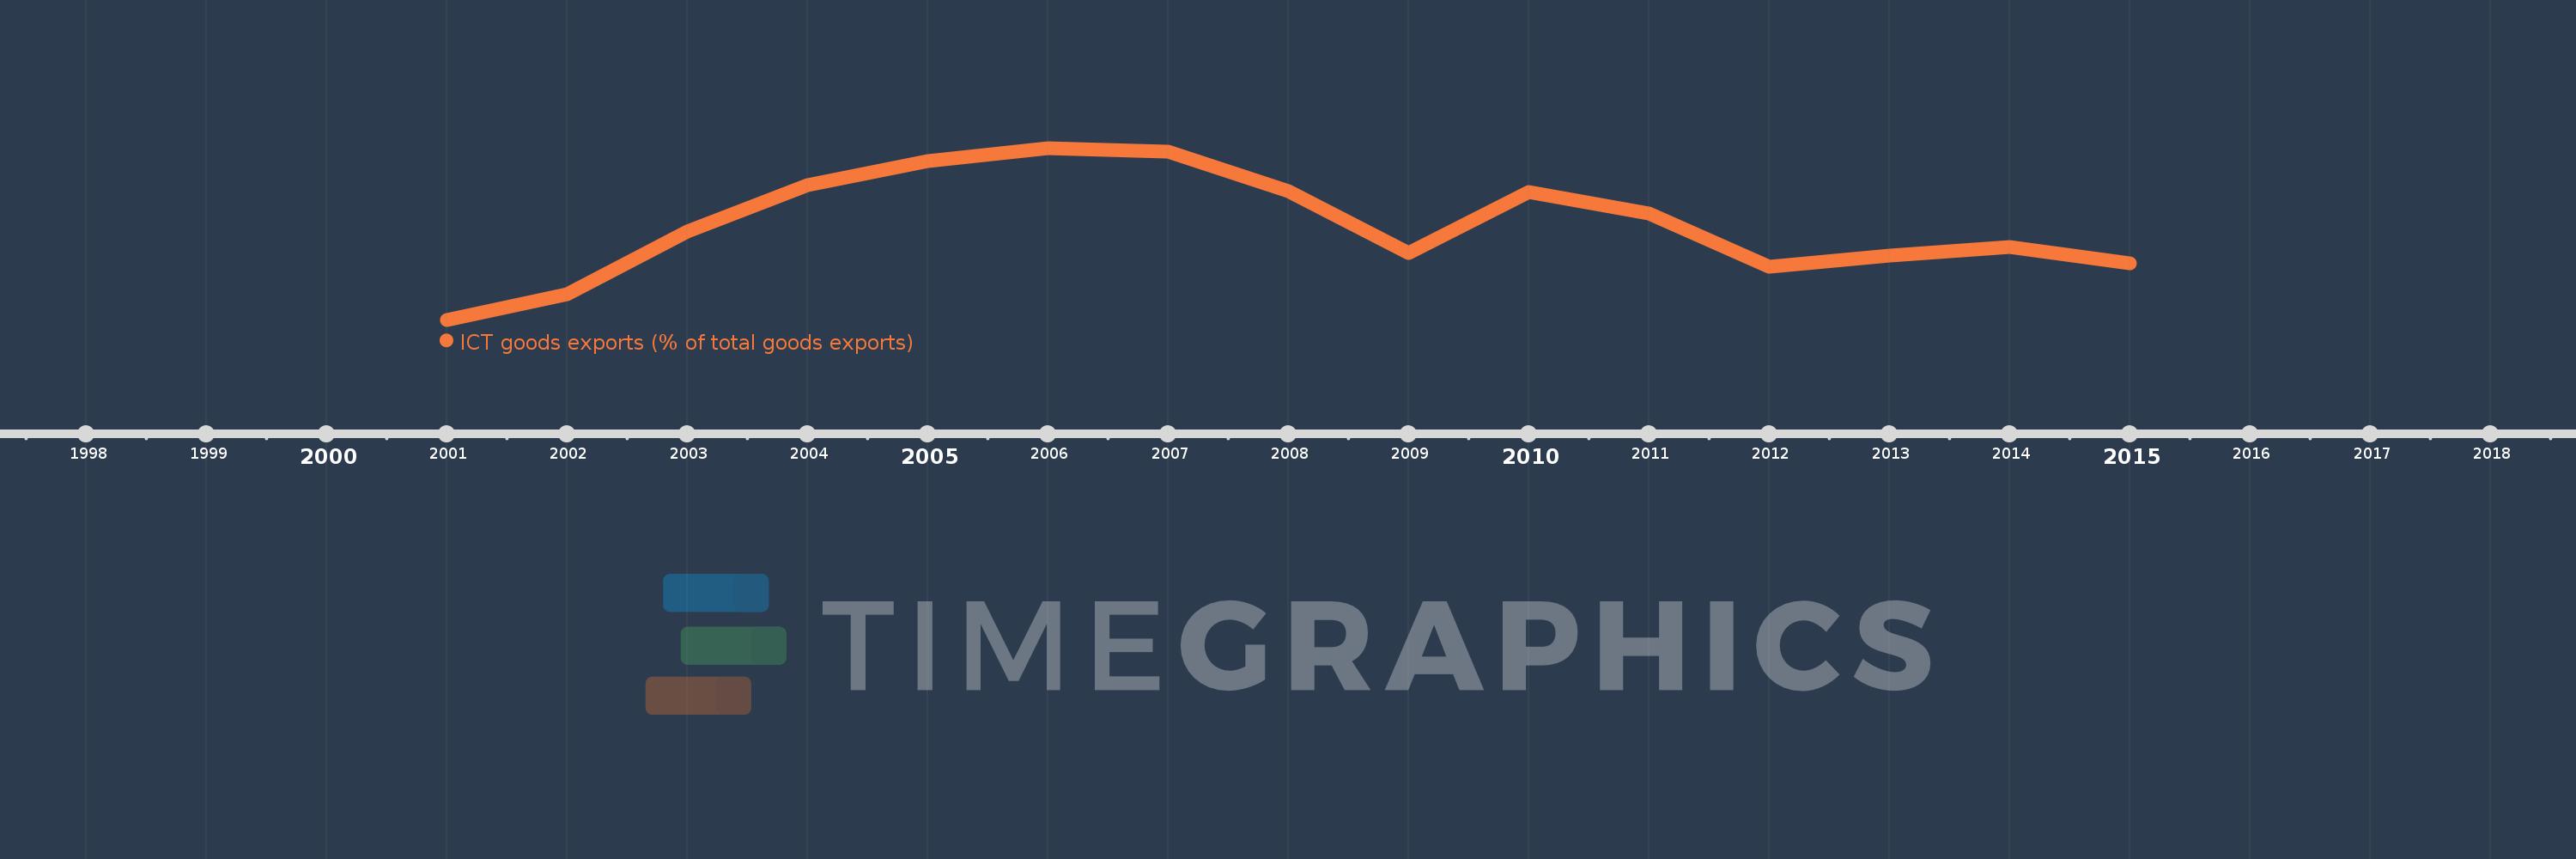
This timeline shows a graph from 2001 to 2015 of East Asia & Pacific (IDA & IBRD countries). No data until 2000. Number of actual observations by date: 15.
Source name:
World Development Indicators
Source organization:
United Nations Conference on Trade and Development's UNCTADstat database at http://unctadstat.unctad.org/ReportFolders/reportFolders.aspx.
Categories, topics:
Infrastructure, Private Sector, Trade
Last updated:
apr 23, 2017
Indicators value changes by year
Meaning:
25.58
Minimum:
21.356
jan 1, 2001
Maximum:
29.003
jan 1, 2006
At the date of observation
Value
Absolute change
Change from the previous value
jan 1, 2001
21.356
+21.356
0.0%
jan 1, 2002
22.483
+1.127
5.28%
jan 1, 2003
25.287
+2.804
12.47%
jan 1, 2004
27.339
+2.052
8.11%
jan 1, 2005
28.415
+1.077
3.94%
jan 1, 2006
29.003
+0.588
2.07%
jan 1, 2007
28.845
-0.158
-0.54%
jan 1, 2008
27.085
-1.76
-6.1%
jan 1, 2009
24.336
-2.75
-10.15%
jan 1, 2010
27.059
+2.723
11.19%
jan 1, 2011
26.083
-0.976
-3.61%
jan 1, 2012
23.727
-2.356
-9.03%
jan 1, 2013
24.218
+0.492
2.07%
jan 1, 2014
24.605
+0.387
1.6%
jan 1, 2015
23.854
-0.751
-3.05%
Ranking of countries by current statistics by years