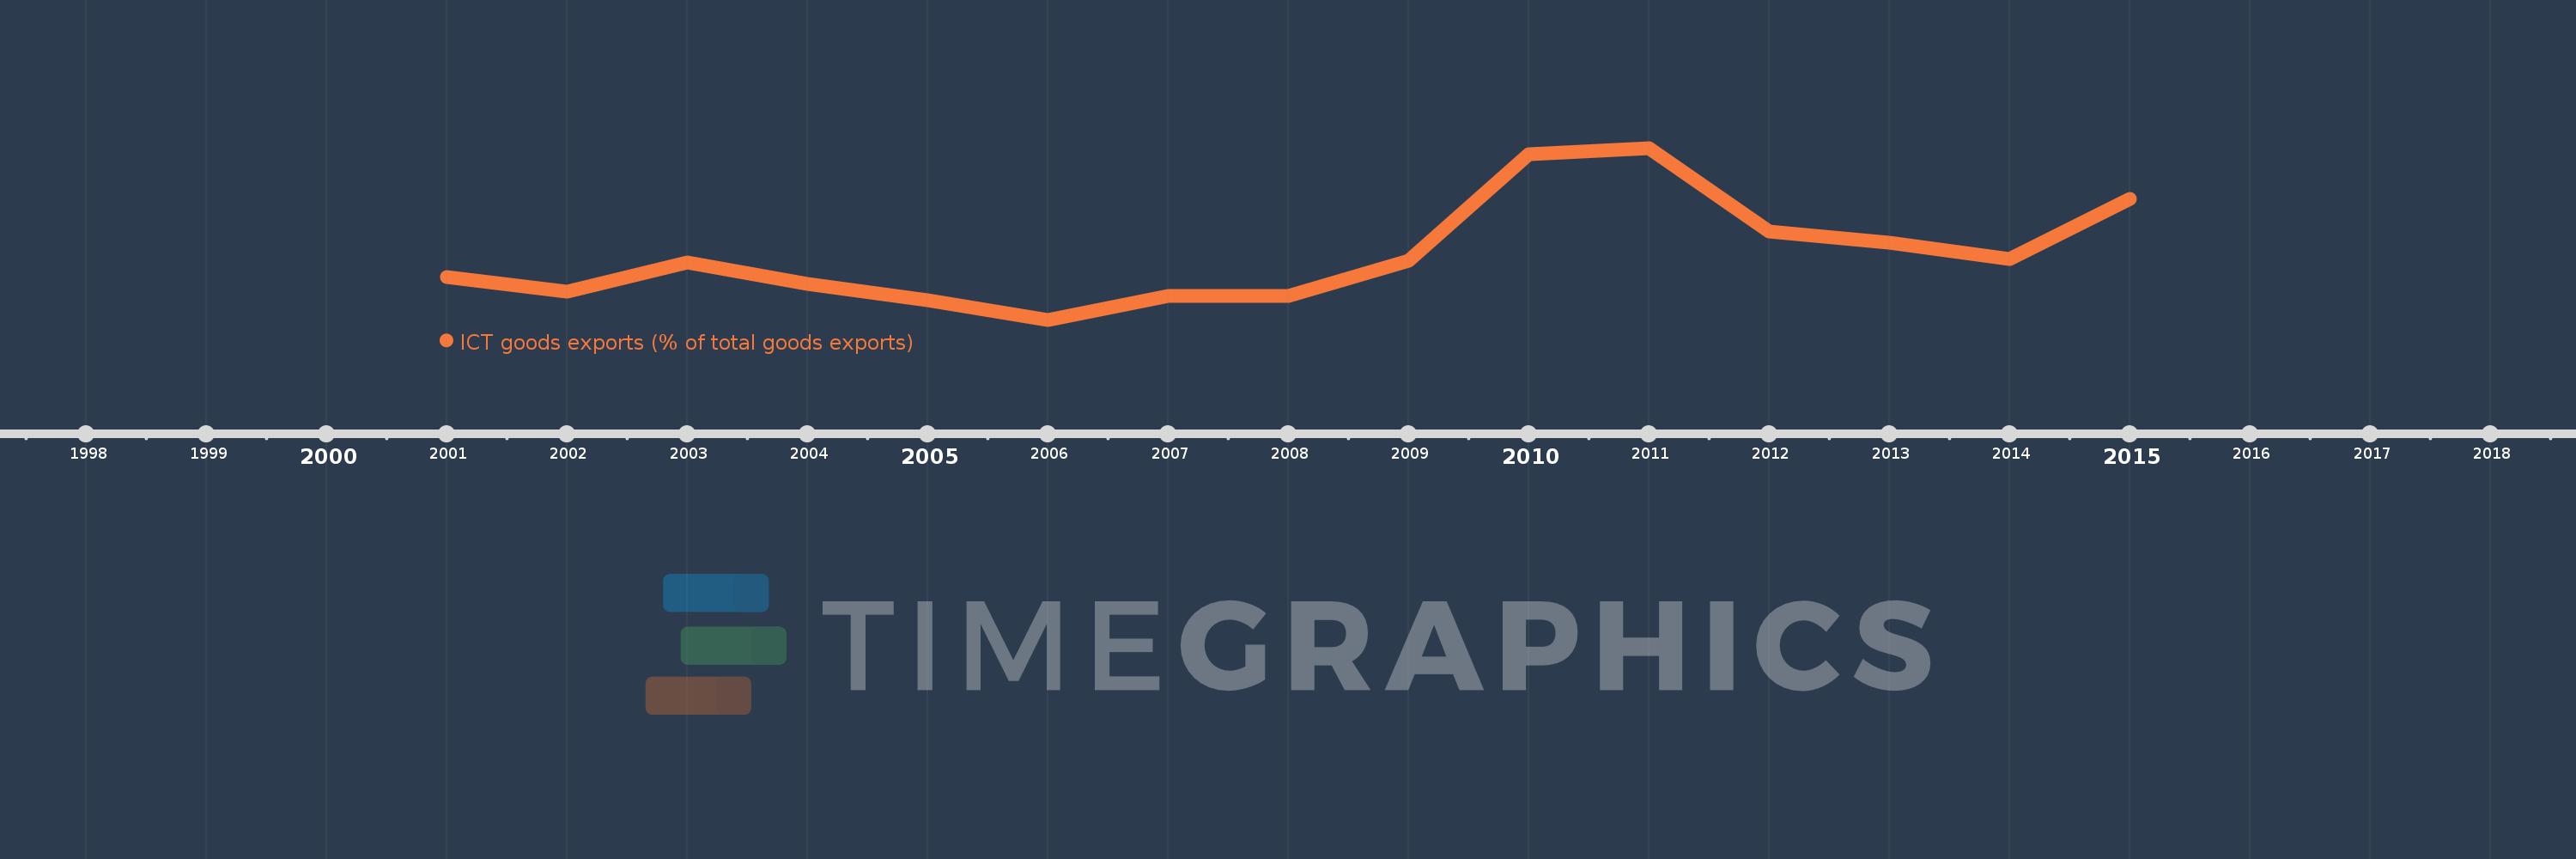
This timeline shows a graph from 2001 to 2015 of Europe & Central Asia (IDA & IBRD countries). No data until 2000. Number of actual observations by date: 15.
Source name:
World Development Indicators
Source organization:
United Nations Conference on Trade and Development's UNCTADstat database at http://unctadstat.unctad.org/ReportFolders/reportFolders.aspx.
Categories, topics:
Infrastructure, Private Sector, Trade
Last updated:
apr 23, 2017
Indicators value changes by year
Meaning:
1.916
Minimum:
1.523
jan 1, 2006
Maximum:
2.561
jan 1, 2011
At the date of observation
Value
Absolute change
Change from the previous value
jan 1, 2001
1.78
+1.78
0.0%
jan 1, 2002
1.695
-0.084
-4.72%
jan 1, 2003
1.867
+0.172
10.12%
jan 1, 2004
1.742
-0.125
-6.71%
jan 1, 2005
1.641
-0.1
-5.77%
jan 1, 2006
1.523
-0.119
-7.22%
jan 1, 2007
1.666
+0.143
9.4%
jan 1, 2008
1.668
+0.002
0.13%
jan 1, 2009
1.878
+0.21
12.56%
jan 1, 2010
2.522
+0.644
34.32%
jan 1, 2011
2.561
+0.039
1.55%
jan 1, 2012
2.054
-0.507
-19.79%
jan 1, 2013
1.991
-0.063
-3.08%
jan 1, 2014
1.892
-0.099
-4.95%
jan 1, 2015
2.253
+0.361
19.08%
Ranking of countries by current statistics by years