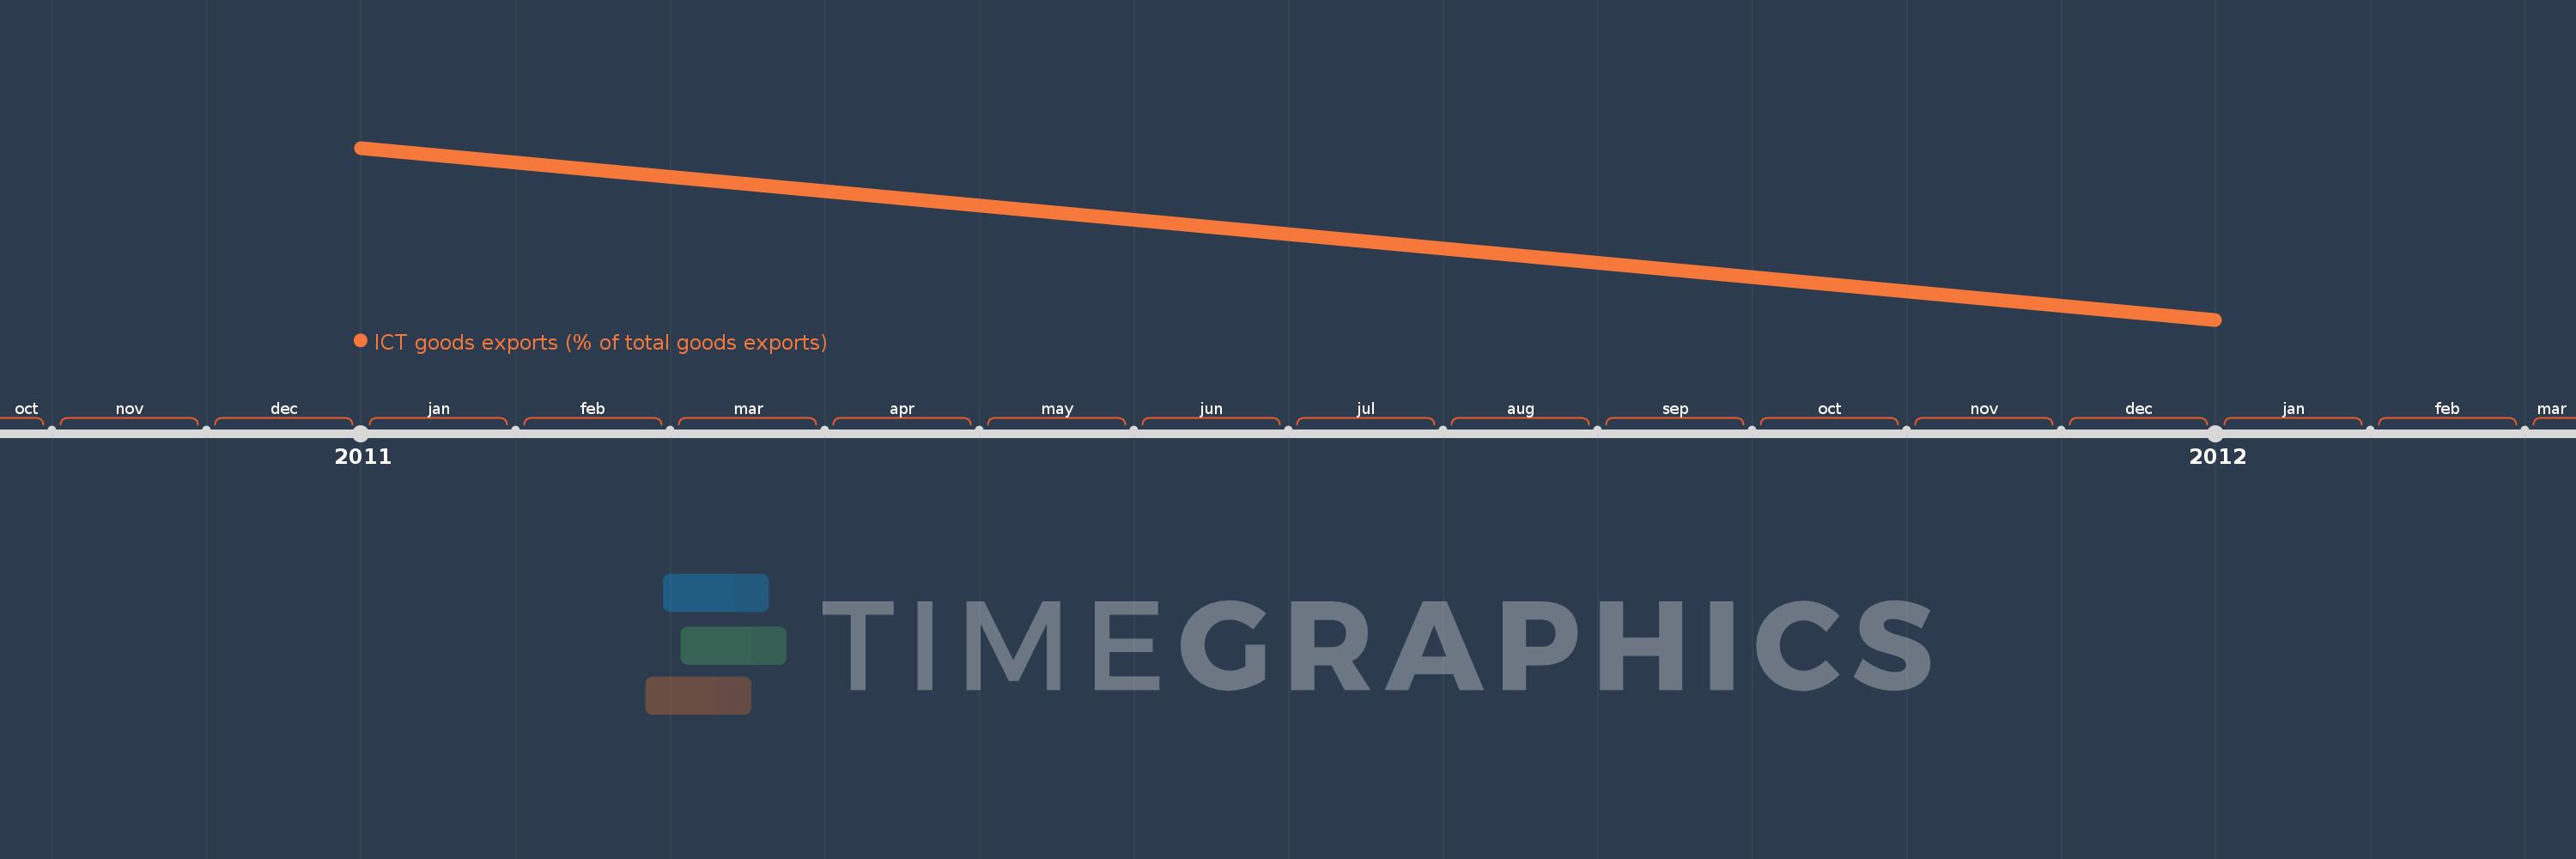
This timeline shows a graph from 2011 to 2012 of Middle East & North Africa (IDA & IBRD countries). No data until 2010. Number of actual observations by date: 2.
Source name:
World Development Indicators
Source organization:
United Nations Conference on Trade and Development's UNCTADstat database at http://unctadstat.unctad.org/ReportFolders/reportFolders.aspx.
Categories, topics:
Infrastructure, Private Sector, Trade
Last updated:
apr 23, 2017
Indicators value changes by year
Meaning:
0.872
Minimum:
0.843
jan 1, 2012
Maximum:
0.901
jan 1, 2011
At the date of observation
Value
Absolute change
Change from the previous value
jan 1, 2011
0.901
+0.901
0.0%
jan 1, 2012
0.843
-0.058
-6.42%
Ranking of countries by current statistics by years