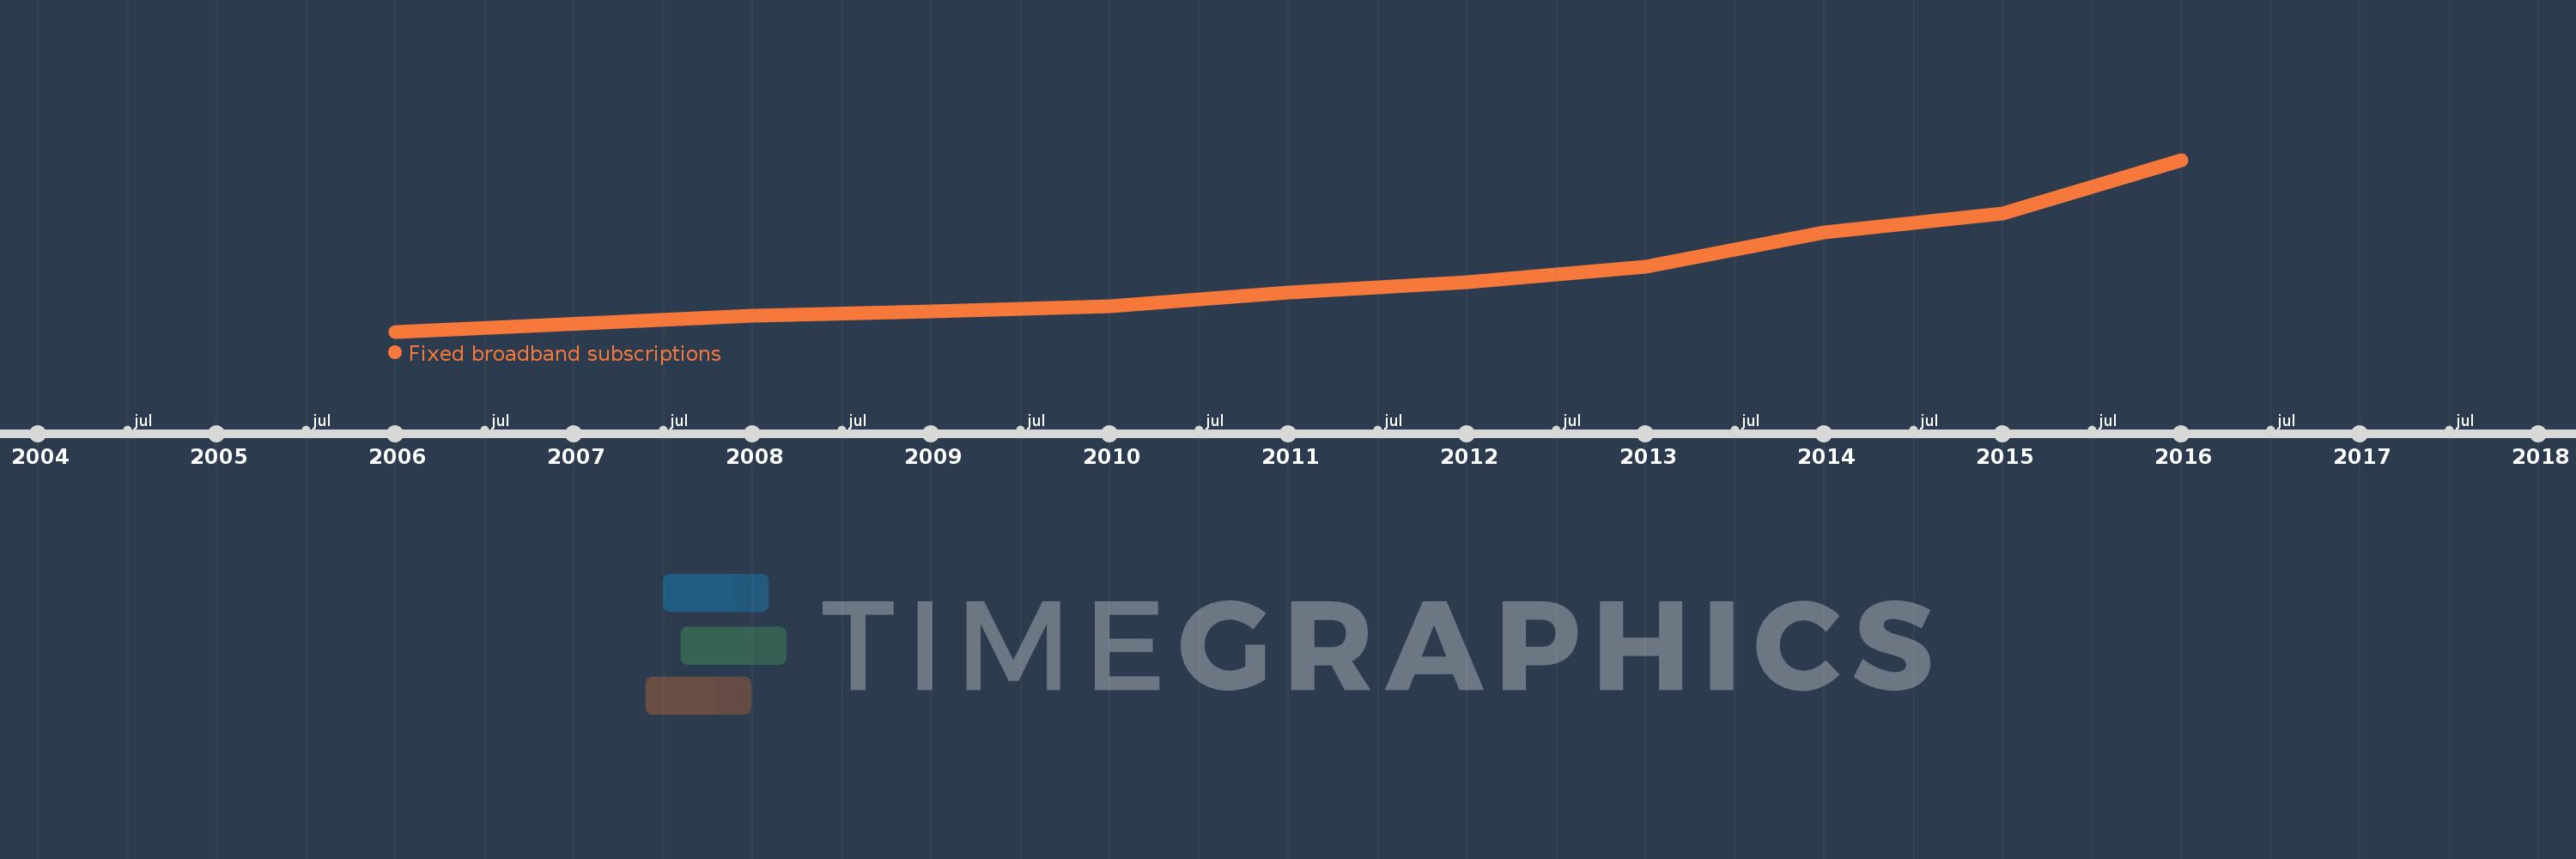
This timeline shows a graph from 2006 to 2016 of Sub-Saharan Africa (IDA & IBRD countries). No data until 2005. Number of actual observations by date: 10.
Source name:
World Development Indicators
Source organization:
International Telecommunication Union, World Telecommunication/ICT Development Report and database.
Categories, topics:
Infrastructure
Last updated:
apr 23, 2017
Indicators value changes by year
Meaning:
1.964 mln
Minimum:
221.153K
jan 1, 2006
Maximum:
5.181 mln
jan 1, 2016
At the date of observation
Value
Absolute change
Change from the previous value
jan 1, 2006
221.153K
+221.153K
0.0%
jan 1, 2008
671.085K
+449.932K
203.45%
jan 1, 2009
800.281K
+129.196K
19.25%
jan 1, 2010
951.245K
+150.964K
18.86%
jan 1, 2011
1.348 mln
+396.514K
41.68%
jan 1, 2012
1.654 mln
+306.547K
22.74%
jan 1, 2013
2.102 mln
+447.56K
27.05%
jan 1, 2014
3.074 mln
+971.919K
46.24%
jan 1, 2015
3.639 mln
+565.354K
18.39%
jan 1, 2016
5.181 mln
+1.542 mln
42.36%
Ranking of countries by current statistics by years