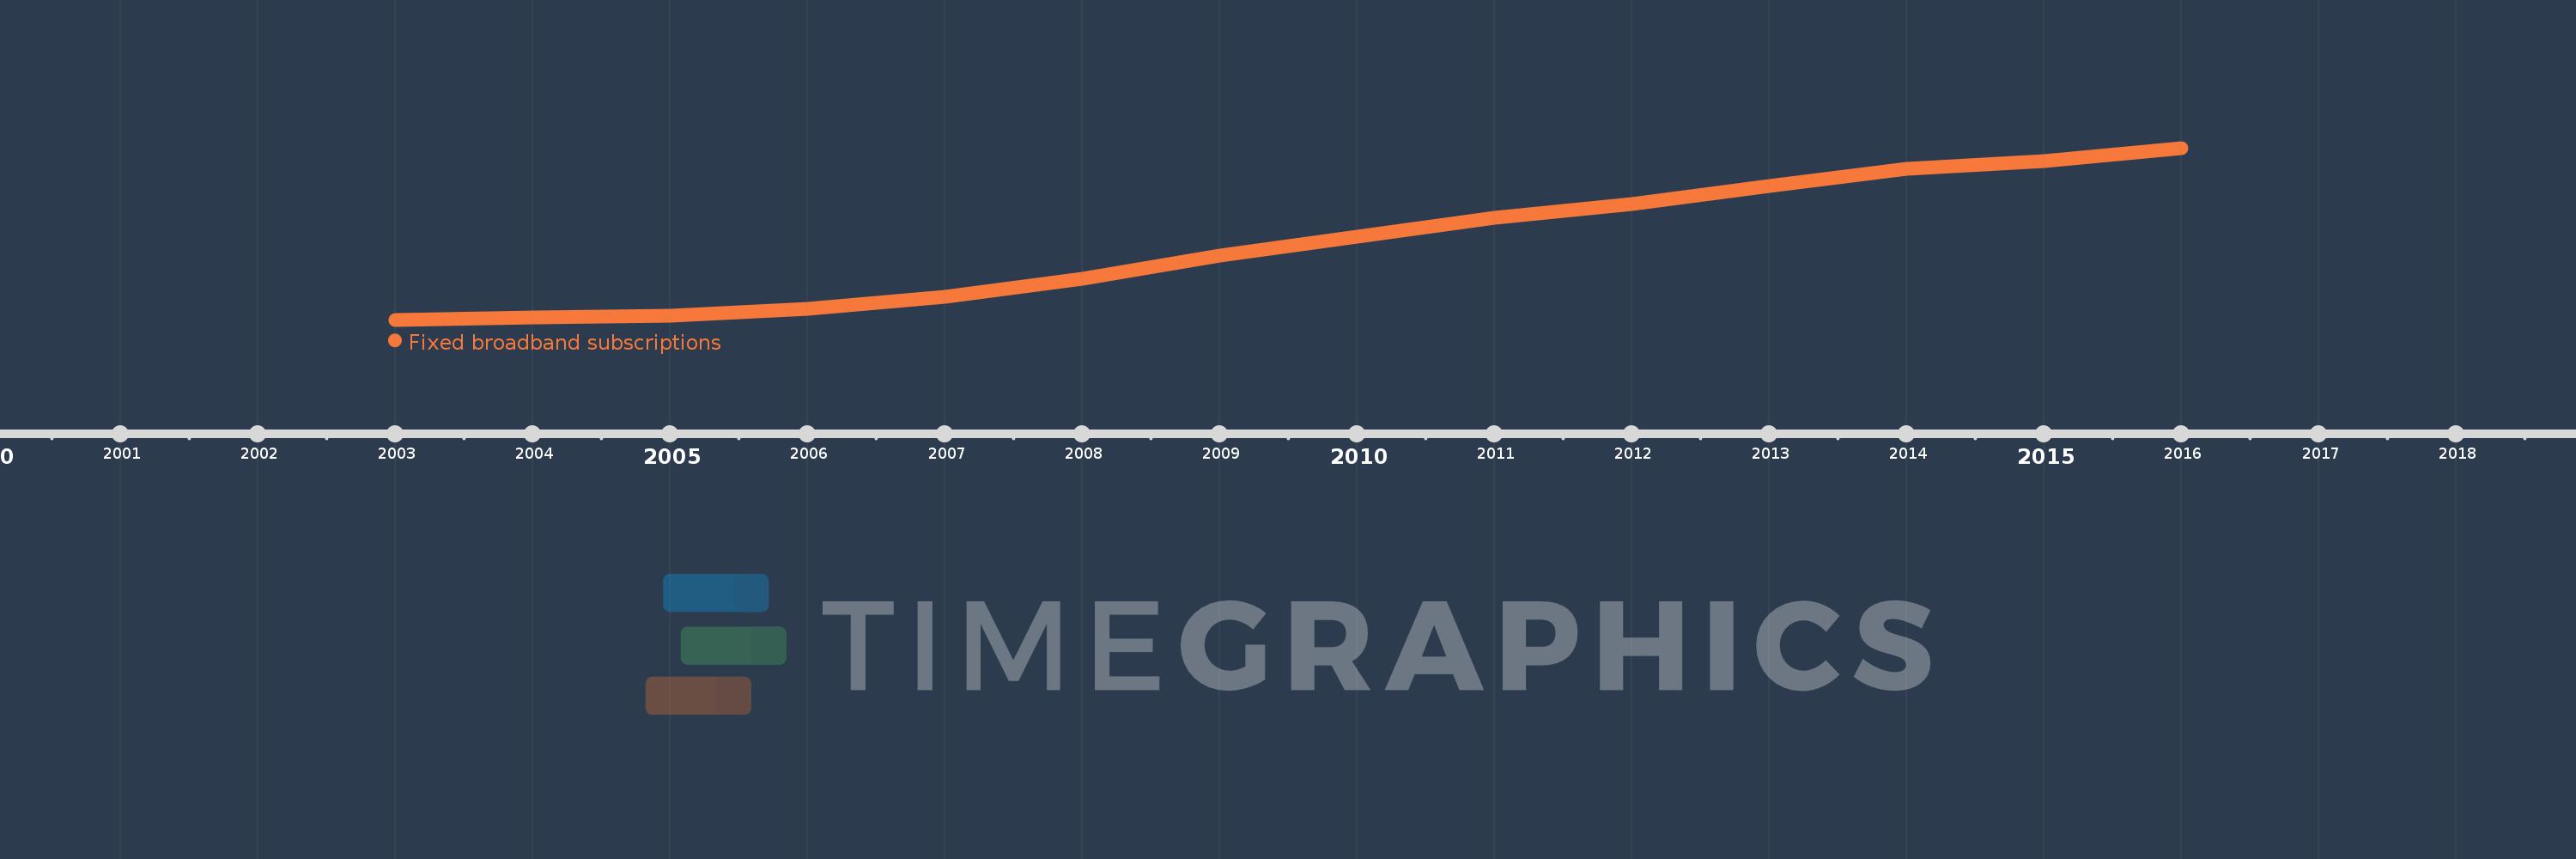
This timeline shows a graph from 2003 to 2016 of Europe & Central Asia (excluding high income). No data until 2002. Number of actual observations by date: 14.
Source name:
World Development Indicators
Source organization:
International Telecommunication Union, World Telecommunication/ICT Development Report and database.
Categories, topics:
Infrastructure
Last updated:
apr 23, 2017
Indicators value changes by year
Meaning:
26.217 mln
Minimum:
50.62K
jan 1, 2003
Maximum:
59.37 mln
jan 1, 2016
At the date of observation
Value
Absolute change
Change from the previous value
jan 1, 2003
50.62K
+50.62K
0.0%
jan 1, 2004
745.974K
+695.354K
1.37K%
jan 1, 2005
1.386 mln
+640.007K
85.79%
jan 1, 2006
3.951 mln
+2.565 mln
185.07%
jan 1, 2007
7.973 mln
+4.022 mln
101.79%
jan 1, 2008
14.158 mln
+6.185 mln
77.58%
jan 1, 2009
22.133 mln
+7.976 mln
56.33%
jan 1, 2010
28.594 mln
+6.46 mln
29.19%
jan 1, 2011
35.264 mln
+6.67 mln
23.33%
jan 1, 2012
40.035 mln
+4.771 mln
13.53%
jan 1, 2013
46.318 mln
+6.283 mln
15.69%
jan 1, 2014
52.29 mln
+5.972 mln
12.89%
jan 1, 2015
54.771 mln
+2.482 mln
4.75%
jan 1, 2016
59.37 mln
+4.598 mln
8.4%
Ranking of countries by current statistics by years