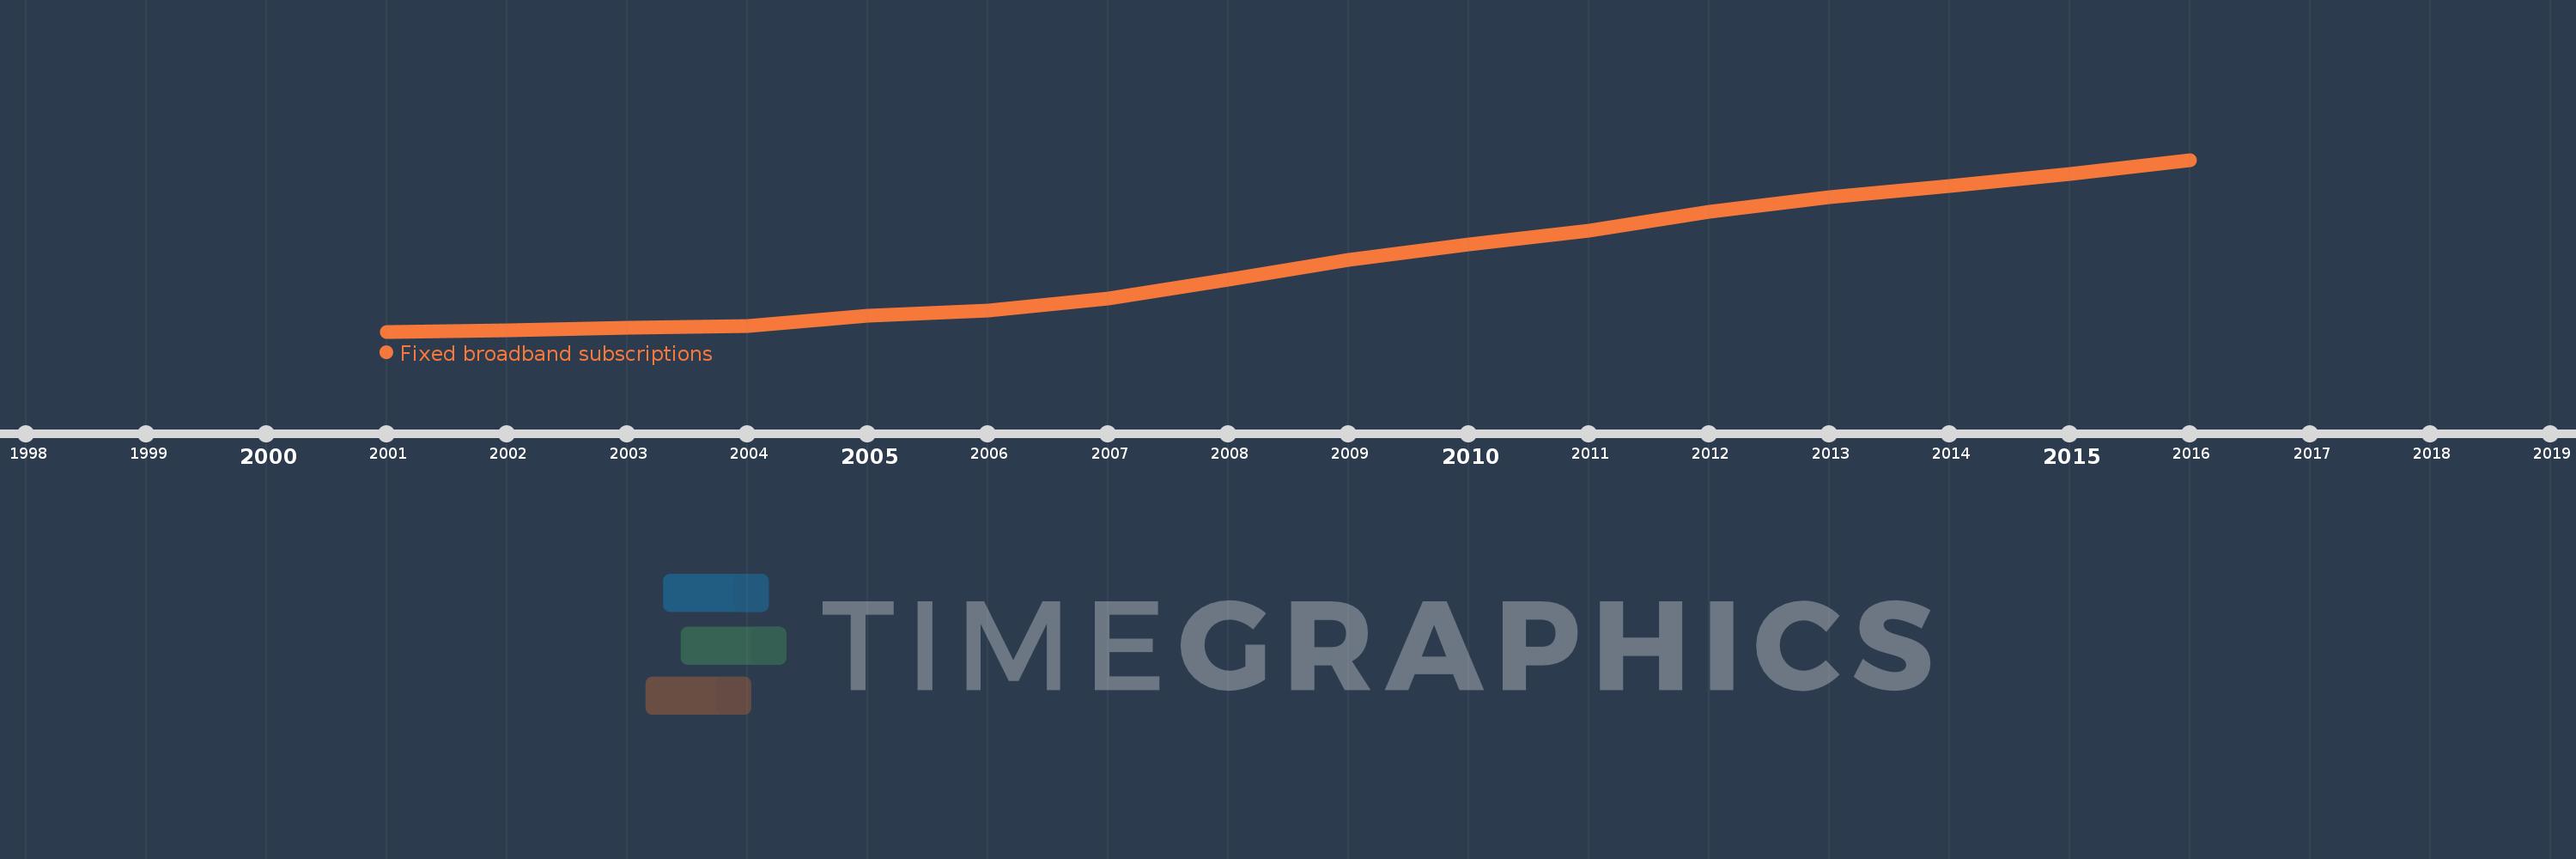
This timeline shows a graph from 2001 to 2016 of Latin America & the Caribbean (IDA & IBRD countries). No data until 2000. Number of actual observations by date: 16.
Source name:
World Development Indicators
Source organization:
International Telecommunication Union, World Telecommunication/ICT Development Report and database.
Categories, topics:
Infrastructure
Last updated:
apr 23, 2017
Indicators value changes by year
Meaning:
26.713 mln
Minimum:
138.033K
jan 1, 2001
Maximum:
65.255 mln
jan 1, 2016
At the date of observation
Value
Absolute change
Change from the previous value
jan 1, 2001
138.033K
+138.033K
0.0%
jan 1, 2002
607.978K
+469.945K
340.46%
jan 1, 2003
1.497 mln
+888.931K
146.21%
jan 1, 2004
2.381 mln
+884.452K
59.09%
jan 1, 2005
6.018 mln
+3.636 mln
152.7%
jan 1, 2006
8.209 mln
+2.192 mln
36.42%
jan 1, 2007
12.759 mln
+4.55 mln
55.42%
jan 1, 2008
19.738 mln
+6.979 mln
54.69%
jan 1, 2009
27.262 mln
+7.524 mln
38.12%
jan 1, 2010
33.075 mln
+5.813 mln
21.32%
jan 1, 2011
38.486 mln
+5.411 mln
16.36%
jan 1, 2012
45.578 mln
+7.092 mln
18.43%
jan 1, 2013
51.002 mln
+5.423 mln
11.9%
jan 1, 2014
55.383 mln
+4.382 mln
8.59%
jan 1, 2015
60.016 mln
+4.633 mln
8.36%
jan 1, 2016
65.255 mln
+5.239 mln
8.73%
Ranking of countries by current statistics by years