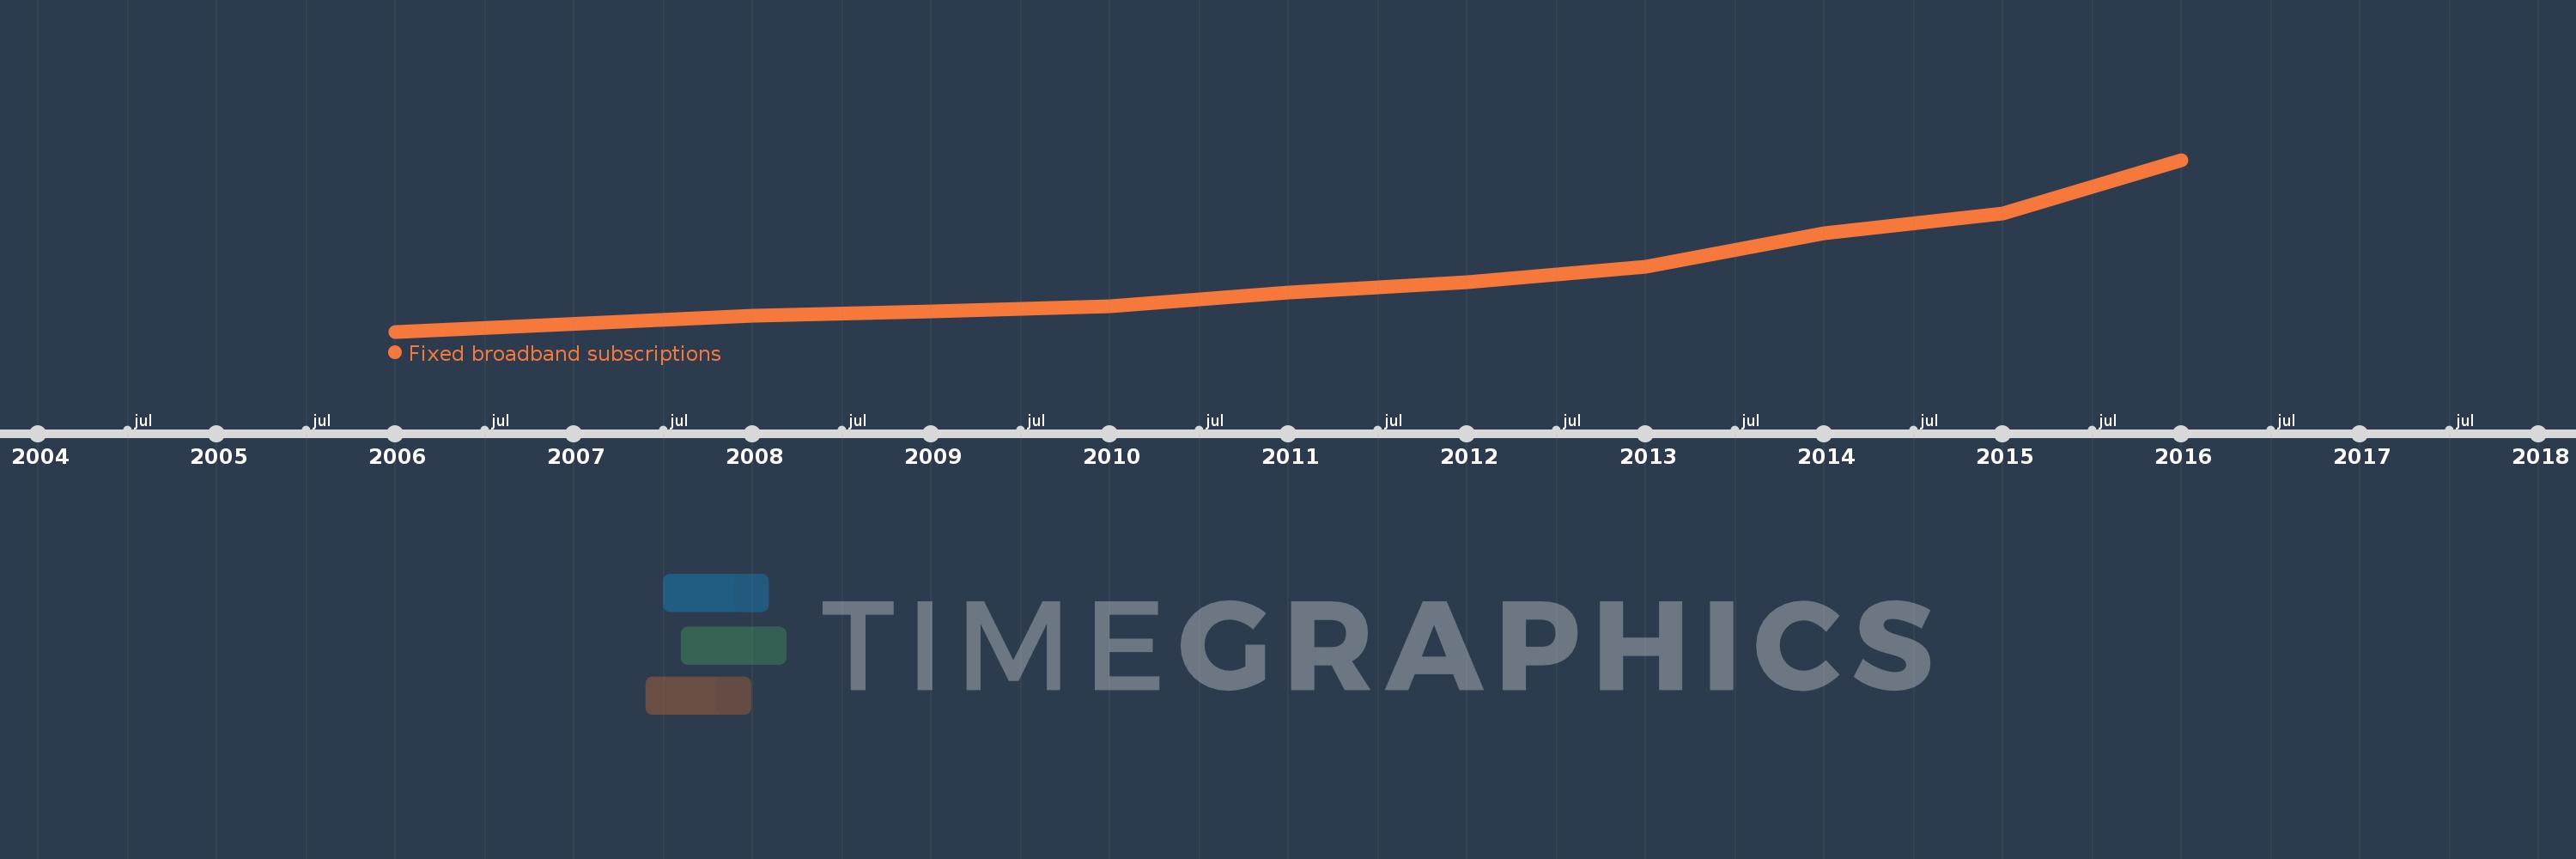
This timeline shows a graph from 2006 to 2016 of Sub-Saharan Africa (excluding high income). No data until 2005. Number of actual observations by date: 10.
Source name:
World Development Indicators
Source organization:
International Telecommunication Union, World Telecommunication/ICT Development Report and database.
Categories, topics:
Infrastructure
Last updated:
apr 23, 2017
Indicators value changes by year
Meaning:
1.956 mln
Minimum:
220.205K
jan 1, 2006
Maximum:
5.167 mln
jan 1, 2016
At the date of observation
Value
Absolute change
Change from the previous value
jan 1, 2006
220.205K
+220.205K
0.0%
jan 1, 2008
667.592K
+447.387K
203.17%
jan 1, 2009
796.864K
+129.272K
19.36%
jan 1, 2010
946.691K
+149.827K
18.8%
jan 1, 2011
1.341 mln
+394.275K
41.65%
jan 1, 2012
1.645 mln
+303.928K
22.66%
jan 1, 2013
2.091 mln
+446.395K
27.14%
jan 1, 2014
3.061 mln
+970.085K
46.39%
jan 1, 2015
3.627 mln
+565.938K
18.49%
jan 1, 2016
5.167 mln
+1.54 mln
42.46%
Ranking of countries by current statistics by years