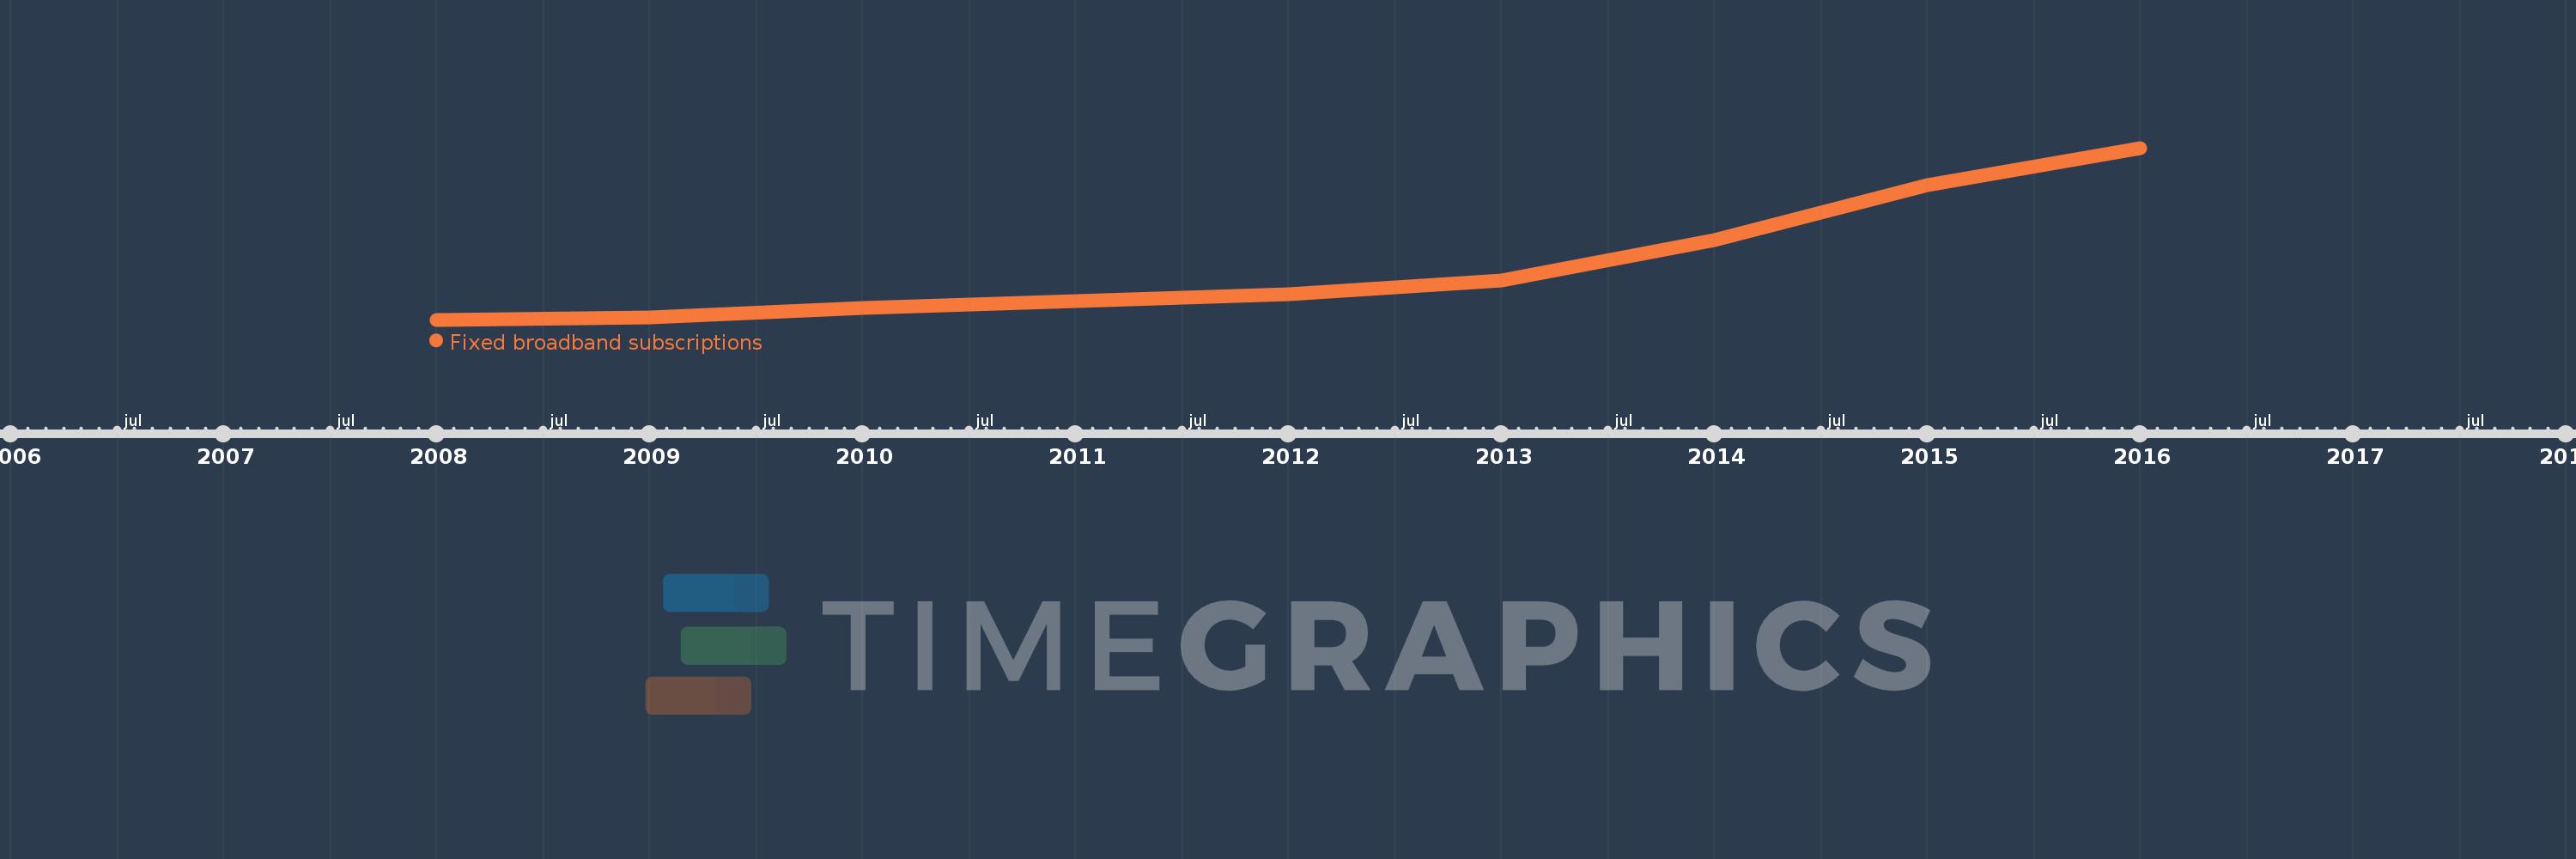
This timeline shows a graph from 2008 to 2016 of Least developed countries: UN classification. No data until 2007. Number of actual observations by date: 9.
Source name:
World Development Indicators
Source organization:
International Telecommunication Union, World Telecommunication/ICT Development Report and database.
Categories, topics:
Infrastructure
Last updated:
apr 23, 2017
Indicators value changes by year
Meaning:
2.172 mln
Minimum:
216.734K
jan 1, 2008
Maximum:
6.472 mln
jan 1, 2016
At the date of observation
Value
Absolute change
Change from the previous value
jan 1, 2008
216.734K
+216.734K
0.0%
jan 1, 2009
301.125K
+84.391K
38.94%
jan 1, 2010
638.285K
+337.16K
111.97%
jan 1, 2011
907.645K
+269.36K
42.2%
jan 1, 2012
1.136 mln
+227.858K
25.1%
jan 1, 2013
1.636 mln
+500.261K
44.06%
jan 1, 2014
3.131 mln
+1.495 mln
91.42%
jan 1, 2015
5.107 mln
+1.976 mln
63.11%
jan 1, 2016
6.472 mln
+1.364 mln
26.72%
Ranking of countries by current statistics by years