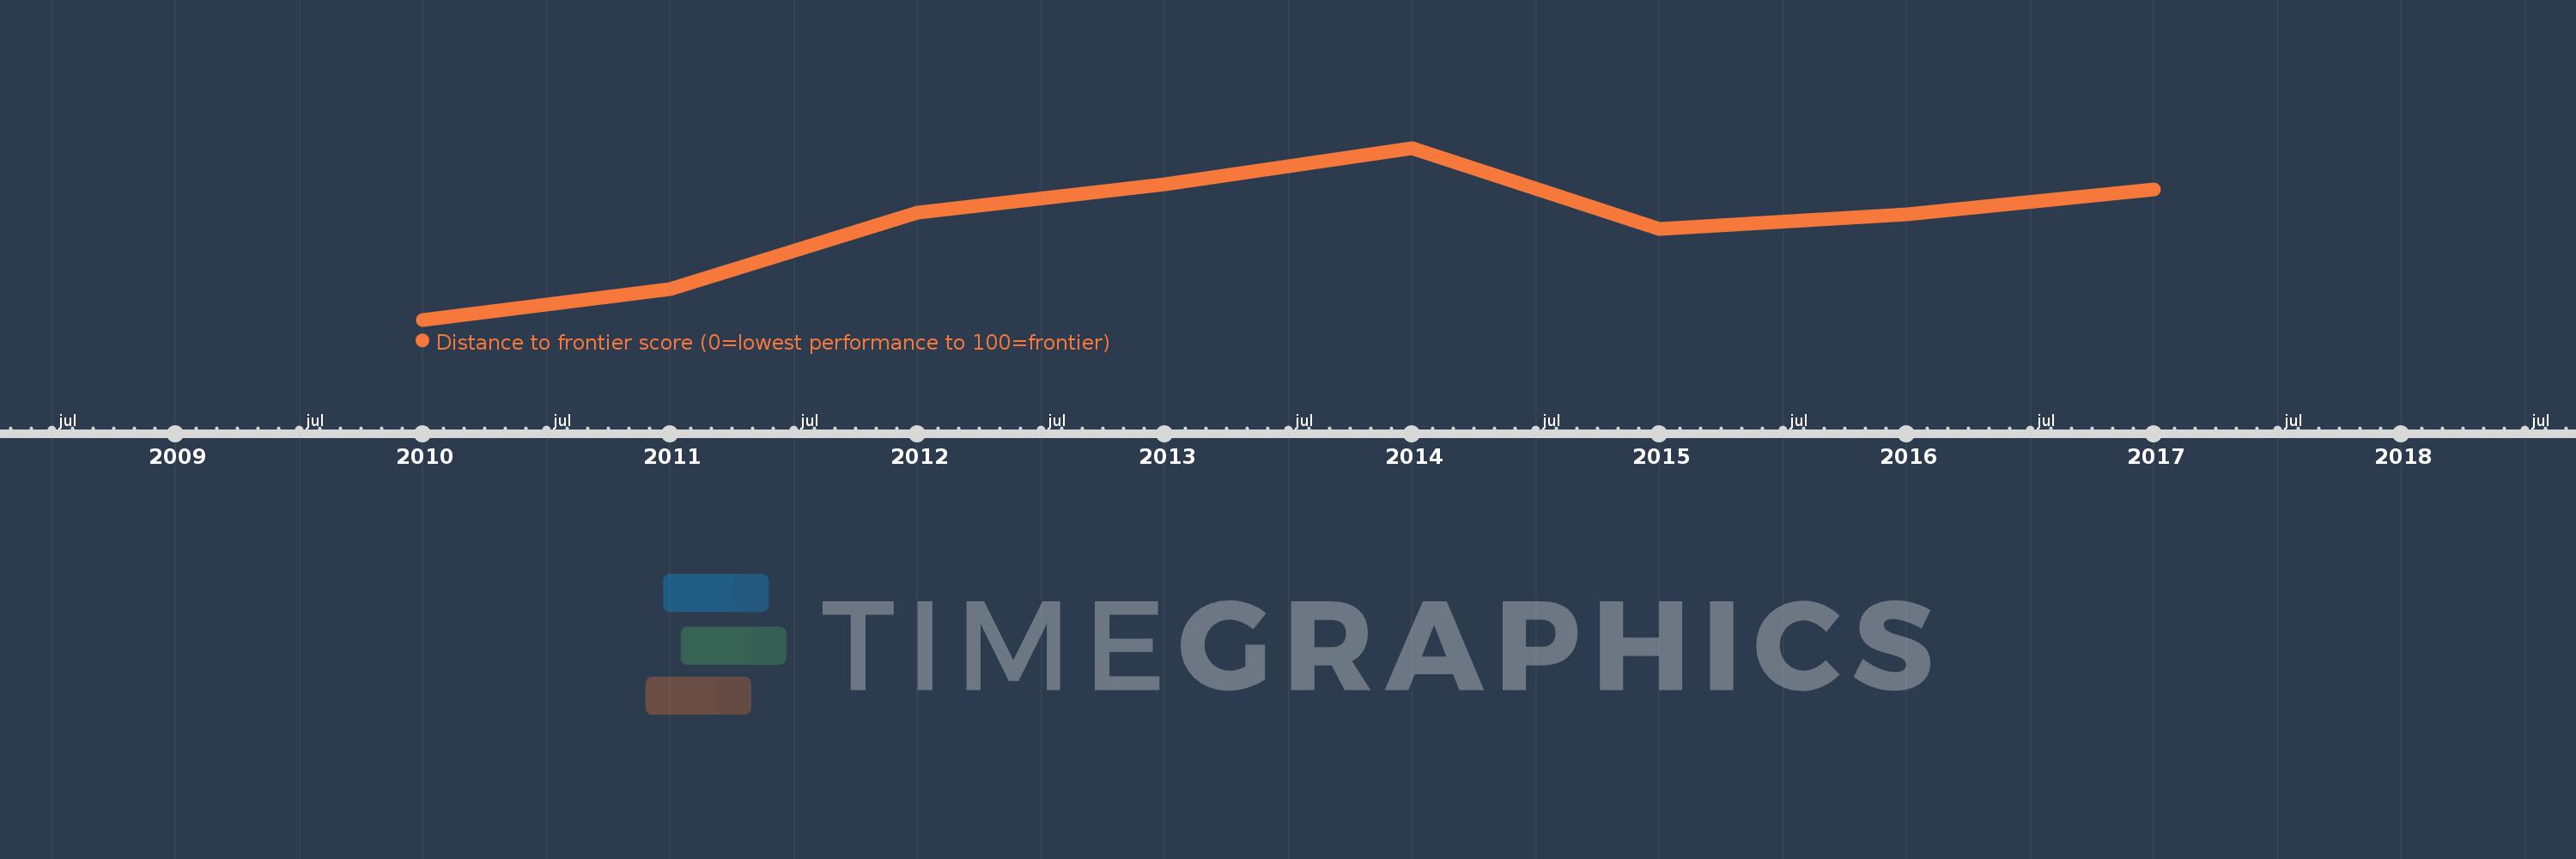
This timeline shows a graph from 2010 to 2017 of Sub-Saharan Africa (IDA & IBRD countries). No data until 2009. Number of actual observations by date: 8.
Source name:
World Development Indicators
Source organization:
World Bank, Doing Business project (http://www.doingbusiness.org/).
Categories, topics:
Private Sector
Last updated:
apr 23, 2017
Indicators value changes by year
Meaning:
48.631
Minimum:
46.142
jan 1, 2010
Maximum:
50.581
jan 1, 2014
At the date of observation
Value
Absolute change
Change from the previous value
jan 1, 2010
46.142
+46.142
0.0%
jan 1, 2011
46.935
+0.793
1.72%
jan 1, 2012
48.905
+1.97
4.2%
jan 1, 2013
49.639
+0.734
1.5%
jan 1, 2014
50.581
+0.942
1.9%
jan 1, 2015
48.484
-2.097
-4.15%
jan 1, 2016
48.855
+0.371
0.76%
jan 1, 2017
49.511
+0.656
1.34%
Ranking of countries by current statistics by years