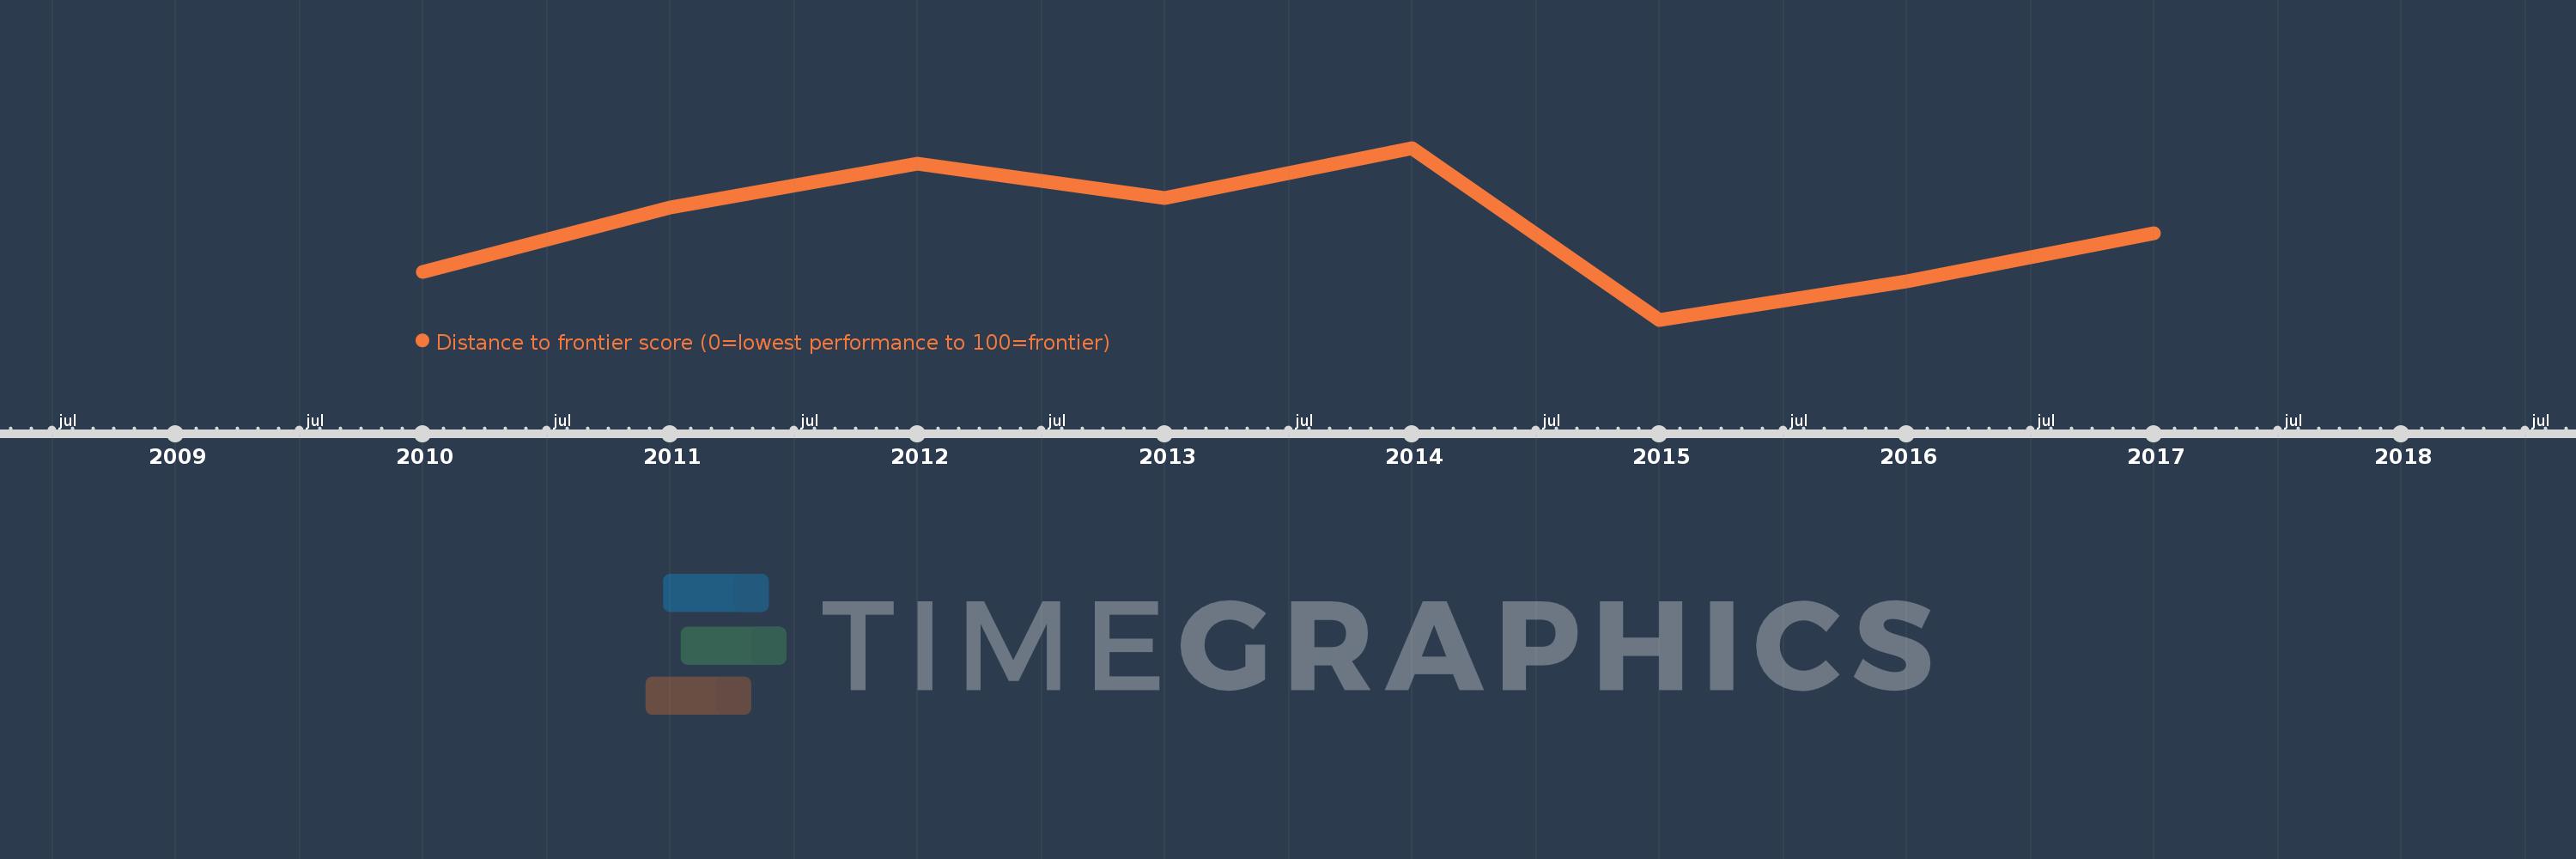
This timeline shows a graph from 2010 to 2017 of East Asia & Pacific (IDA & IBRD countries). No data until 2009. Number of actual observations by date: 8.
Source name:
World Development Indicators
Source organization:
World Bank, Doing Business project (http://www.doingbusiness.org/).
Categories, topics:
Private Sector
Last updated:
apr 23, 2017
Indicators value changes by year
Meaning:
58.809
Minimum:
57.464
jan 1, 2015
Maximum:
59.98
jan 1, 2014
At the date of observation
Value
Absolute change
Change from the previous value
jan 1, 2010
58.169
+58.169
0.0%
jan 1, 2011
59.108
+0.938
1.61%
jan 1, 2012
59.753
+0.645
1.09%
jan 1, 2013
59.242
-0.511
-0.85%
jan 1, 2014
59.98
+0.738
1.25%
jan 1, 2015
57.464
-2.517
-4.2%
jan 1, 2016
58.022
+0.558
0.97%
jan 1, 2017
58.73
+0.708
1.22%
Ranking of countries by current statistics by years