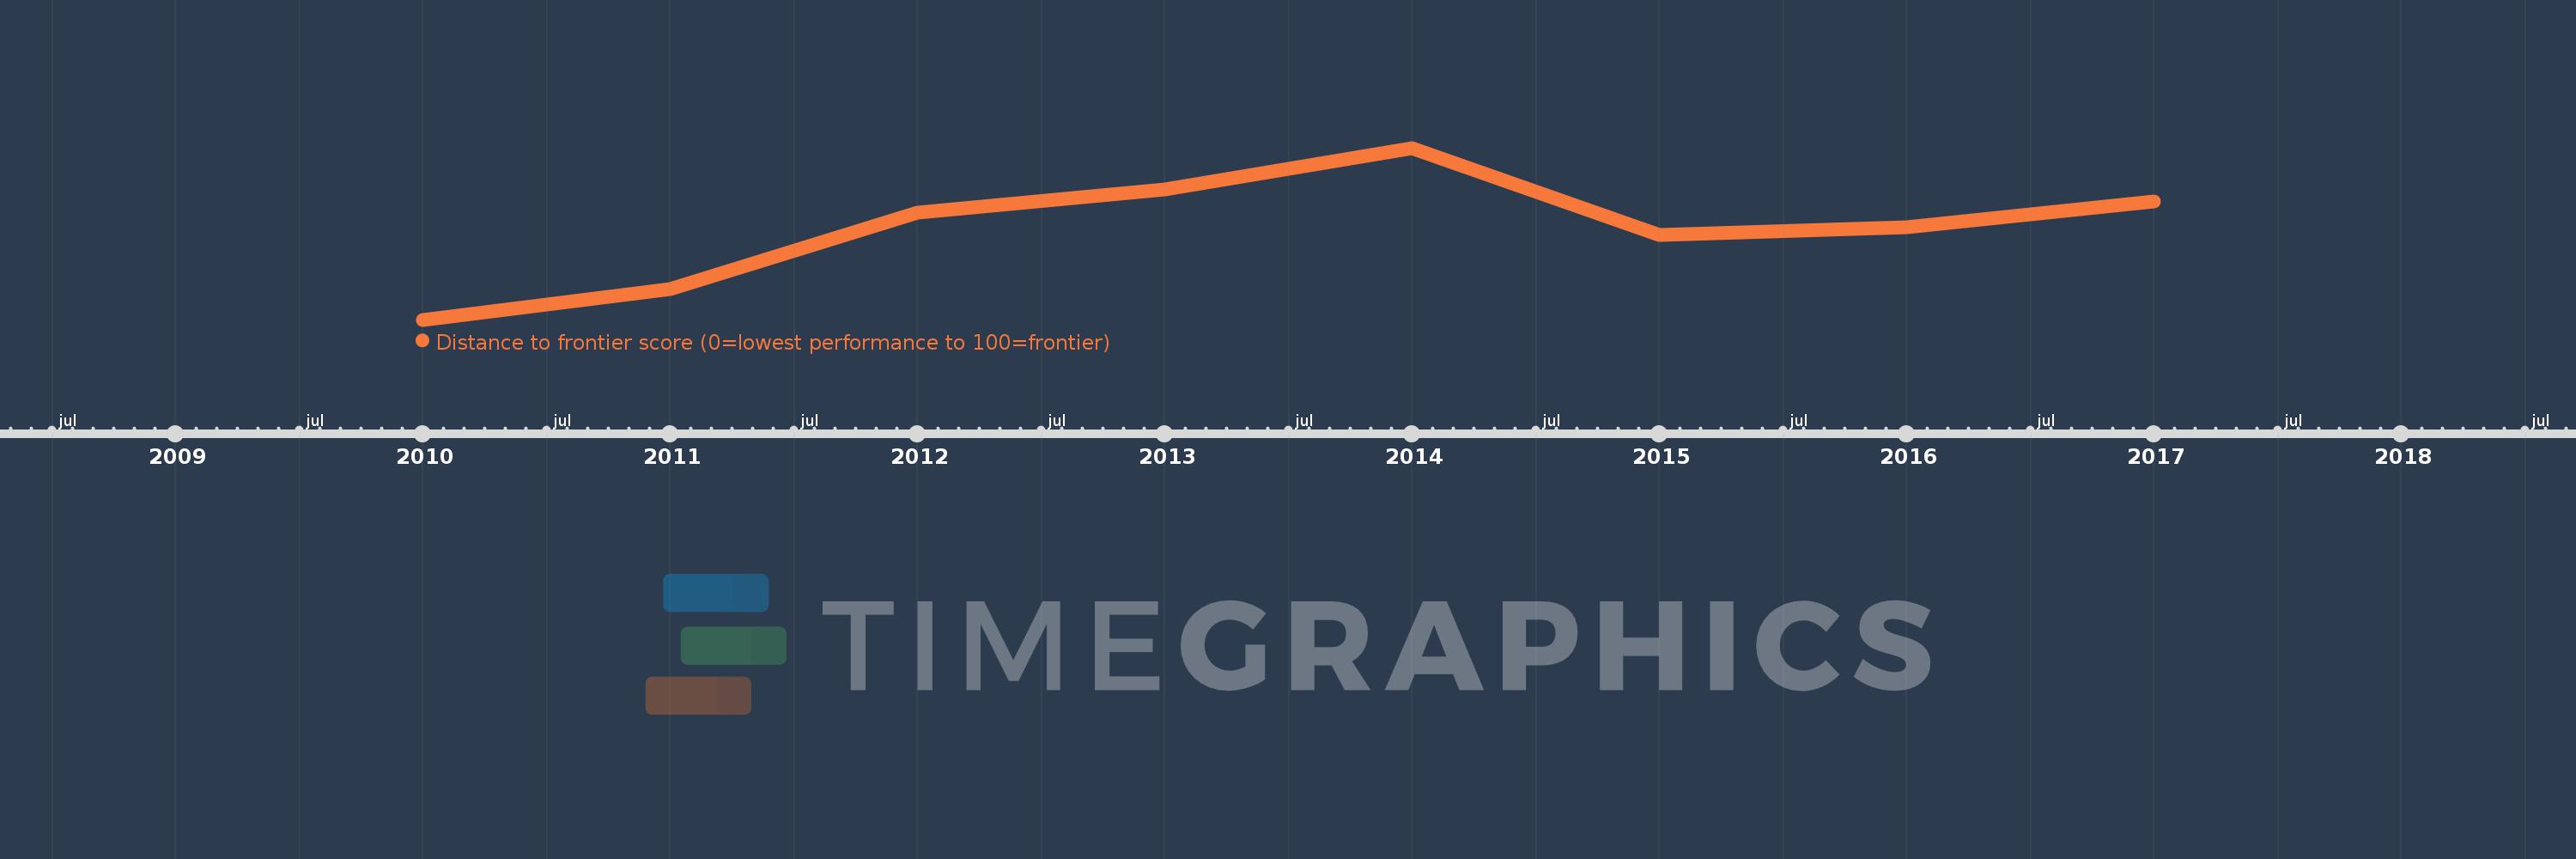
This timeline shows a graph from 2010 to 2017 of Least developed countries: UN classification. No data until 2009. Number of actual observations by date: 8.
Source name:
World Development Indicators
Source organization:
World Bank, Doing Business project (http://www.doingbusiness.org/).
Categories, topics:
Private Sector
Last updated:
apr 23, 2017
Indicators value changes by year
Meaning:
46.962
Minimum:
44.841
jan 1, 2010
Maximum:
48.806
jan 1, 2014
At the date of observation
Value
Absolute change
Change from the previous value
jan 1, 2010
44.841
+44.841
0.0%
jan 1, 2011
45.545
+0.704
1.57%
jan 1, 2012
47.323
+1.778
3.9%
jan 1, 2013
47.851
+0.528
1.12%
jan 1, 2014
48.806
+0.955
2.0%
jan 1, 2015
46.801
-2.005
-4.11%
jan 1, 2016
46.968
+0.168
0.36%
jan 1, 2017
47.564
+0.596
1.27%
Ranking of countries by current statistics by years