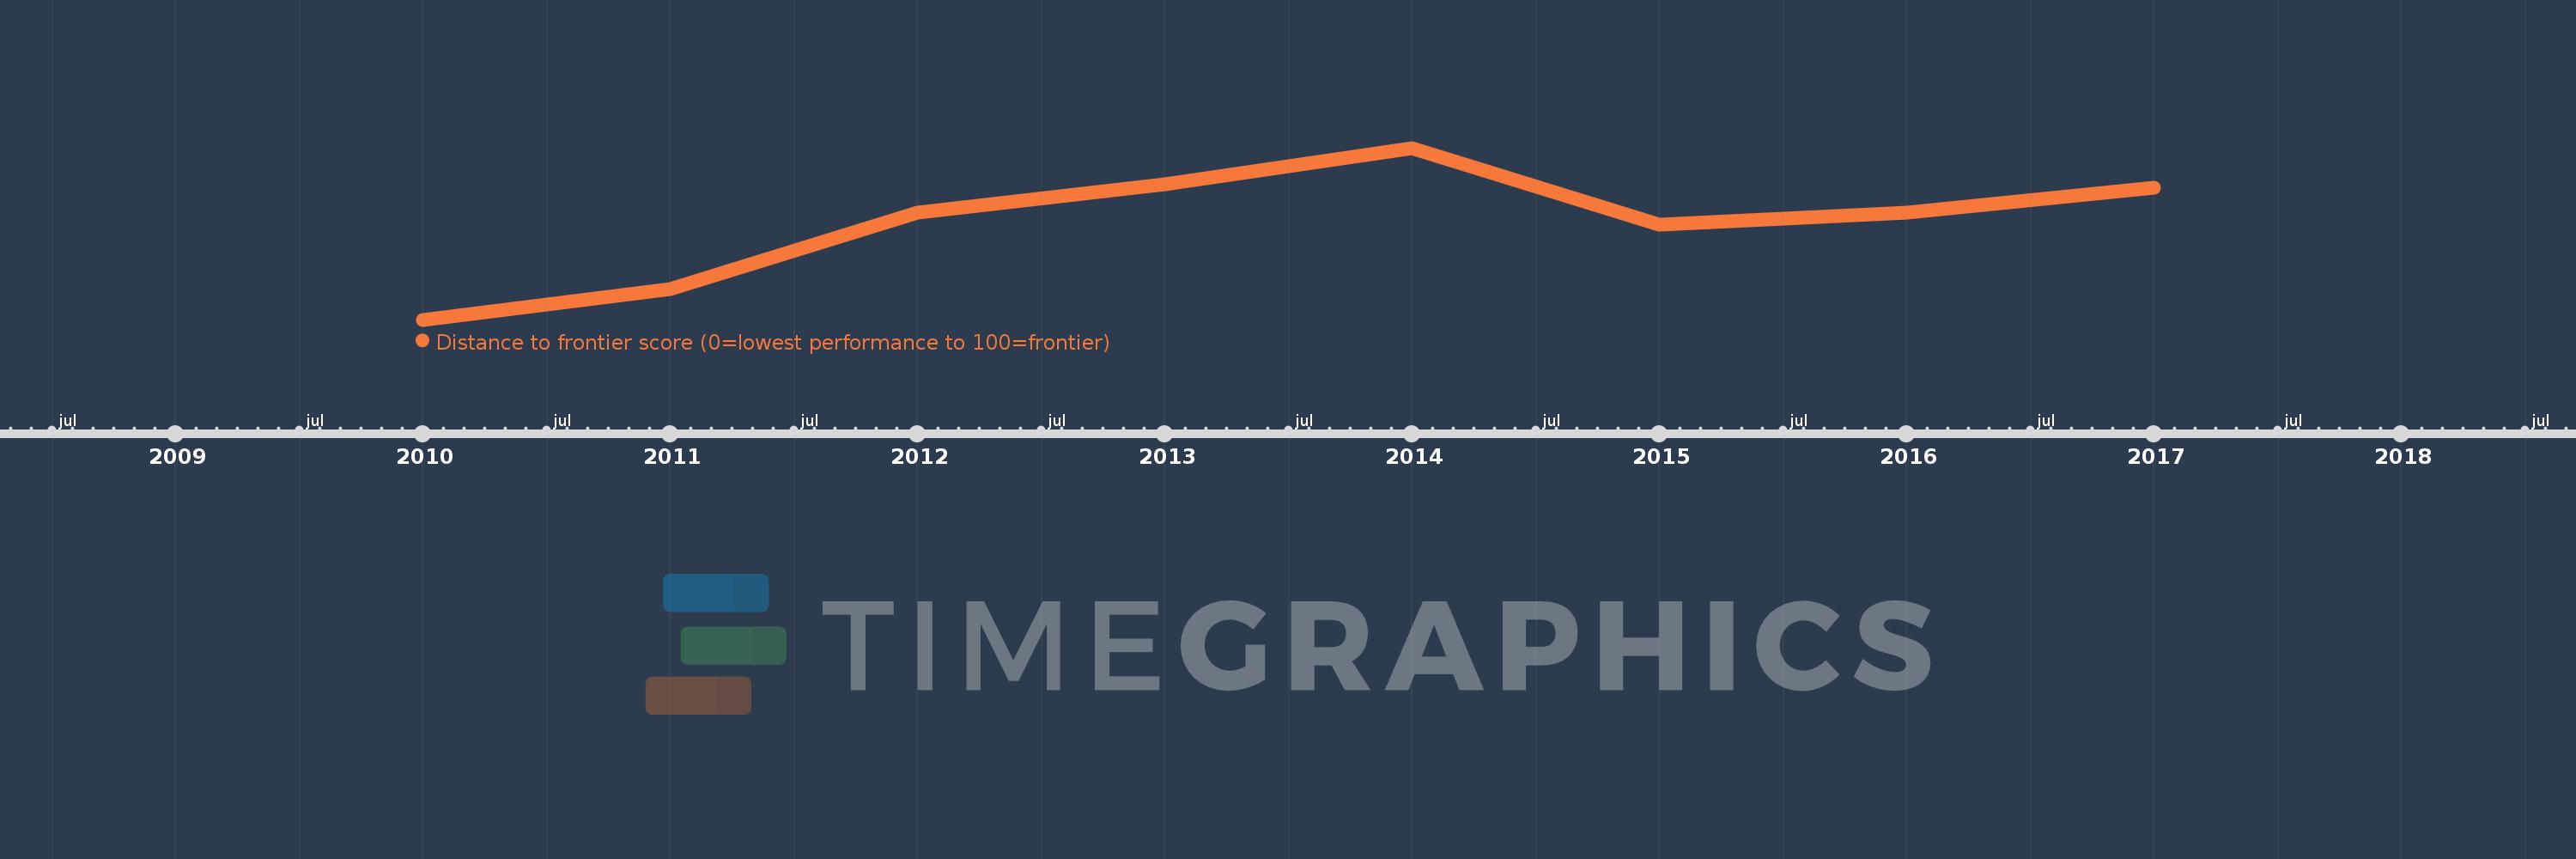
This timeline shows a graph from 2010 to 2017 of Sub-Saharan Africa (excluding high income). No data until 2009. Number of actual observations by date: 8.
Source name:
World Development Indicators
Source organization:
World Bank, Doing Business project (http://www.doingbusiness.org/).
Categories, topics:
Private Sector
Last updated:
apr 23, 2017
Indicators value changes by year
Meaning:
48.345
Minimum:
45.784
jan 1, 2010
Maximum:
50.305
jan 1, 2014
At the date of observation
Value
Absolute change
Change from the previous value
jan 1, 2010
45.784
+45.784
0.0%
jan 1, 2011
46.593
+0.809
1.77%
jan 1, 2012
48.594
+2.001
4.29%
jan 1, 2013
49.351
+0.757
1.56%
jan 1, 2014
50.305
+0.954
1.93%
jan 1, 2015
48.278
-2.028
-4.03%
jan 1, 2016
48.596
+0.319
0.66%
jan 1, 2017
49.262
+0.666
1.37%
Ranking of countries by current statistics by years