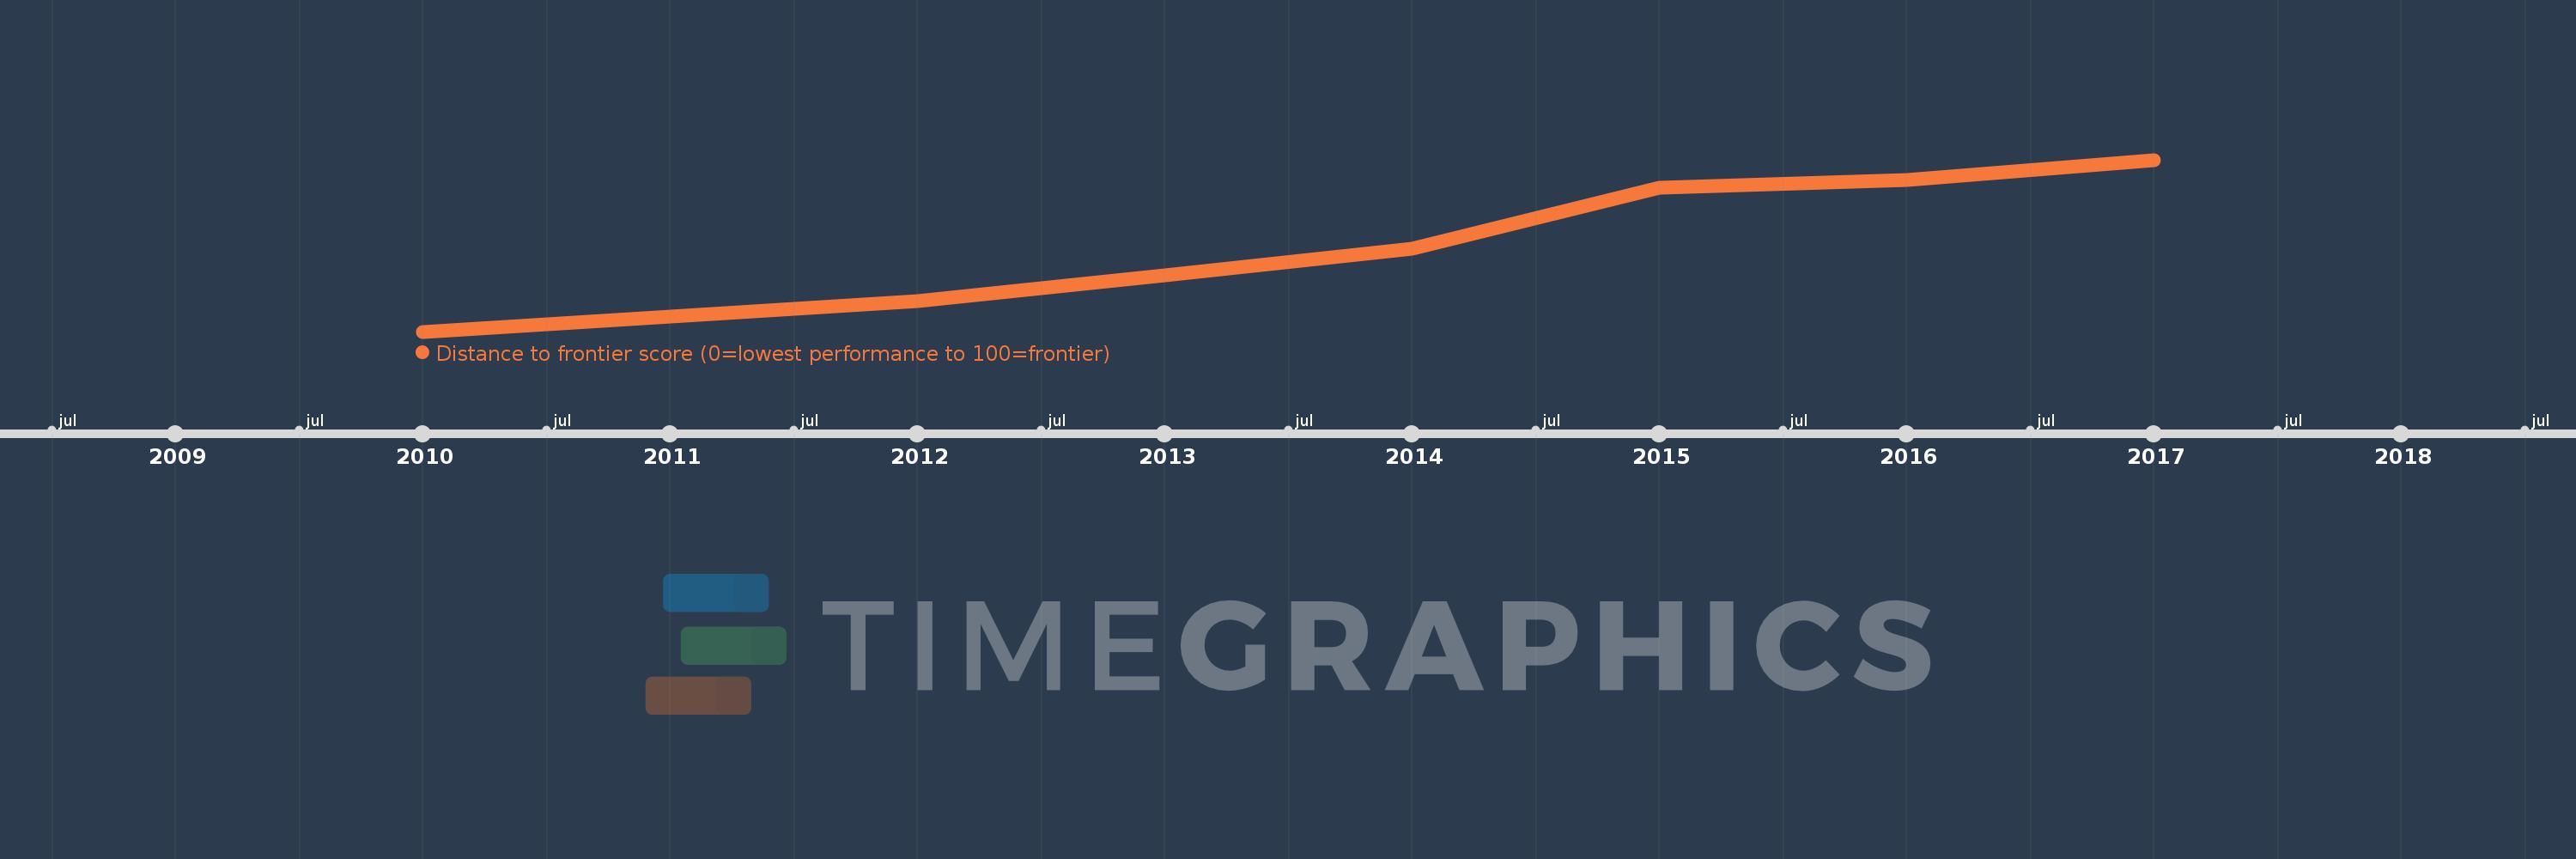
This timeline shows a graph from 2010 to 2017 of Europe & Central Asia (IDA & IBRD countries). No data until 2009. Number of actual observations by date: 8.
Source name:
World Development Indicators
Source organization:
World Bank, Doing Business project (http://www.doingbusiness.org/).
Categories, topics:
Private Sector
Last updated:
apr 23, 2017
Indicators value changes by year
Meaning:
64.112
Minimum:
58.077
jan 1, 2010
Maximum:
70.811
jan 1, 2017
At the date of observation
Value
Absolute change
Change from the previous value
jan 1, 2010
58.077
+58.077
0.0%
jan 1, 2011
59.179
+1.102
1.9%
jan 1, 2012
60.331
+1.152
1.95%
jan 1, 2013
62.23
+1.899
3.15%
jan 1, 2014
64.224
+1.994
3.2%
jan 1, 2015
68.749
+4.525
7.05%
jan 1, 2016
69.295
+0.547
0.8%
jan 1, 2017
70.811
+1.516
2.19%
Ranking of countries by current statistics by years