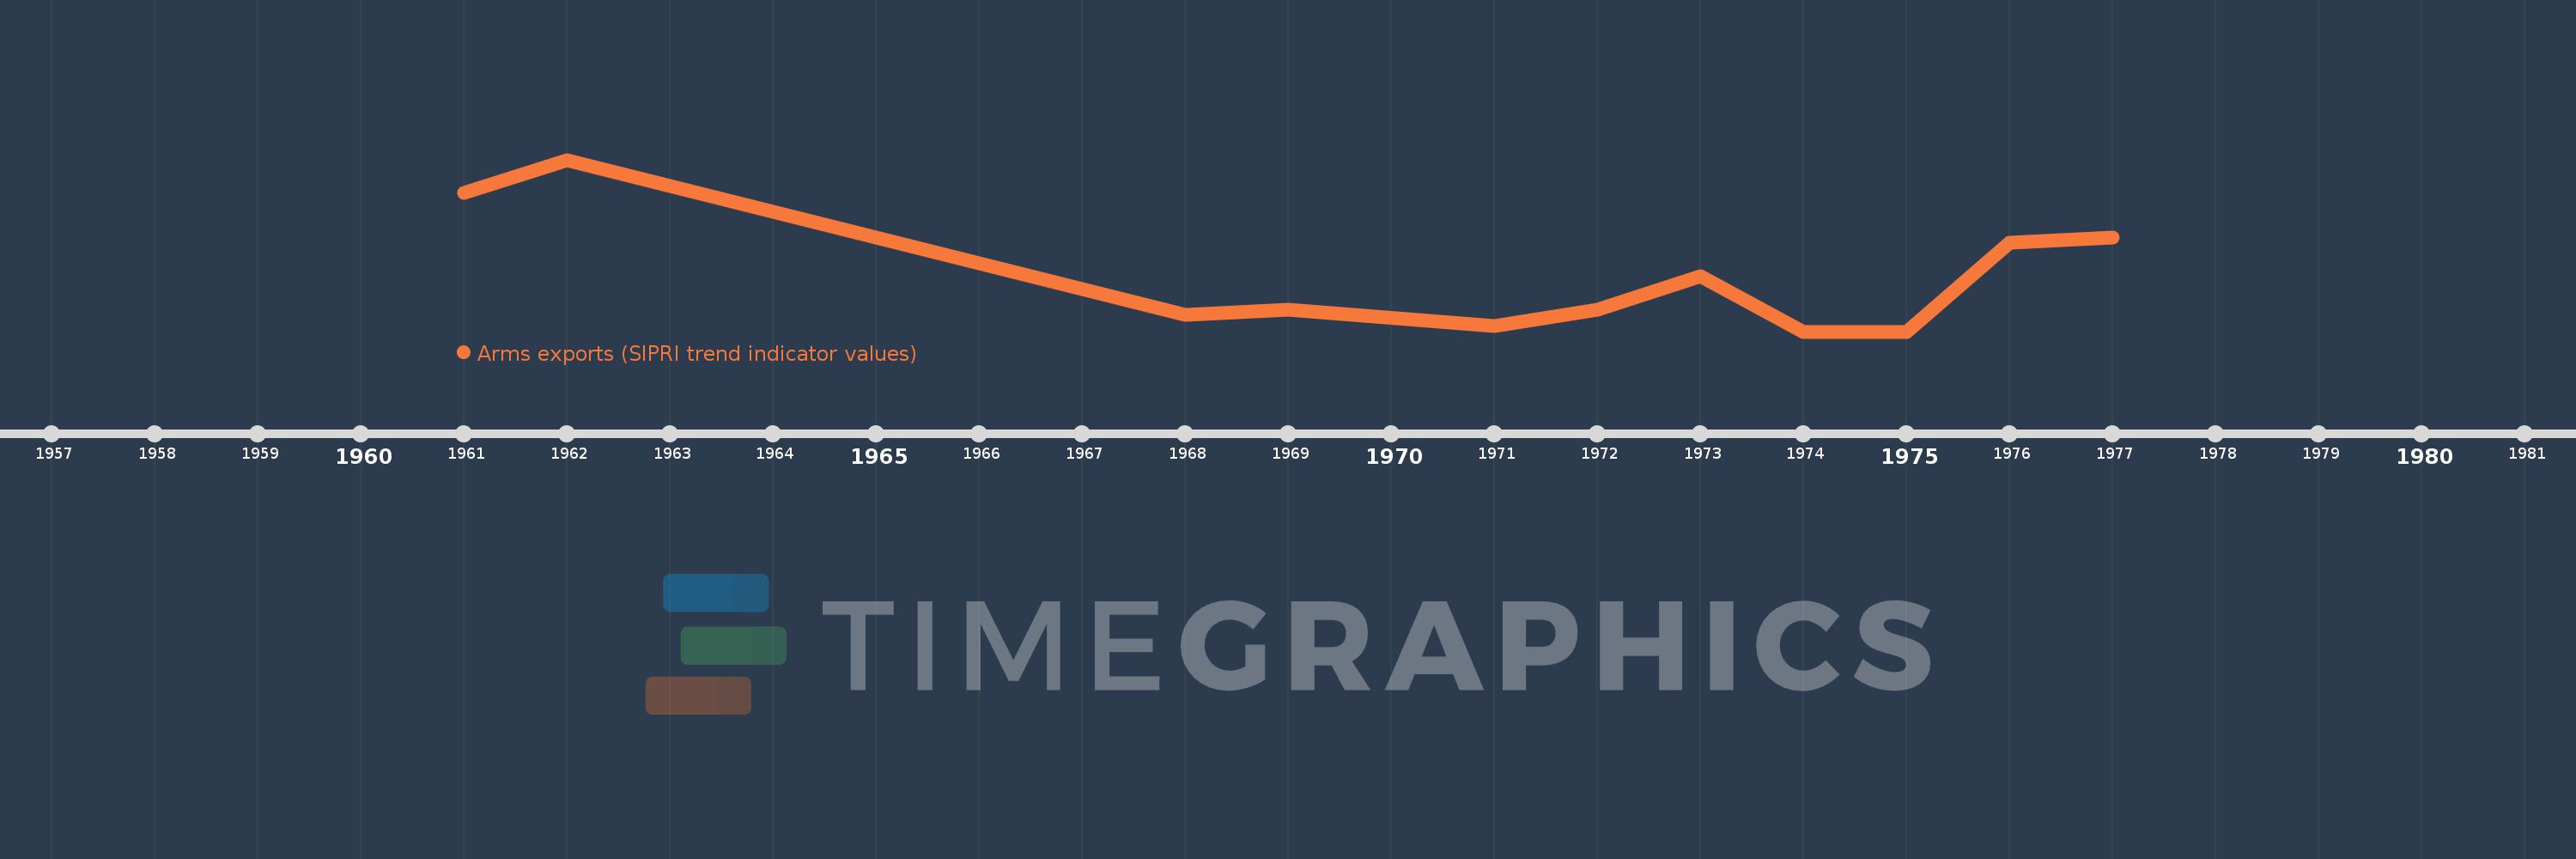
This timeline shows a graph from 1961 to 1977 of Sub-Saharan Africa (IDA & IBRD countries). No data until 1960. Number of actual observations by date: 11.
Source name:
World Development Indicators
Source organization:
Stockholm International Peace Research Institute (SIPRI), Arms Transfers Programme (http://portal.sipri.org/publications/pages/transfer/splash).
Categories, topics:
Public Sector, Trade
Last updated:
apr 23, 2017
Indicators value changes by year
Meaning:
12.091 mln
Minimum:
2.0 mln
jan 1, 1974
Maximum:
33.0 mln
jan 1, 1962
At the date of observation
Value
Absolute change
Change from the previous value
jan 1, 1961
27.0 mln
+27.0 mln
0.0%
jan 1, 1962
33.0 mln
+6.0 mln
22.22%
jan 1, 1968
5.0 mln
-28.0 mln
-84.85%
jan 1, 1969
6.0 mln
+1000.0K
20.0%
jan 1, 1971
3.0 mln
-3.0 mln
-50.0%
jan 1, 1972
6.0 mln
+3.0 mln
100.0%
jan 1, 1973
12.0 mln
+6.0 mln
100.0%
jan 1, 1974
2.0 mln
-10.0 mln
-83.33%
jan 1, 1975
2.0 mln
0.0
0.0%
jan 1, 1976
18.0 mln
+16.0 mln
800.0%
jan 1, 1977
19.0 mln
+1000.0K
5.56%
Ranking of countries by current statistics by years