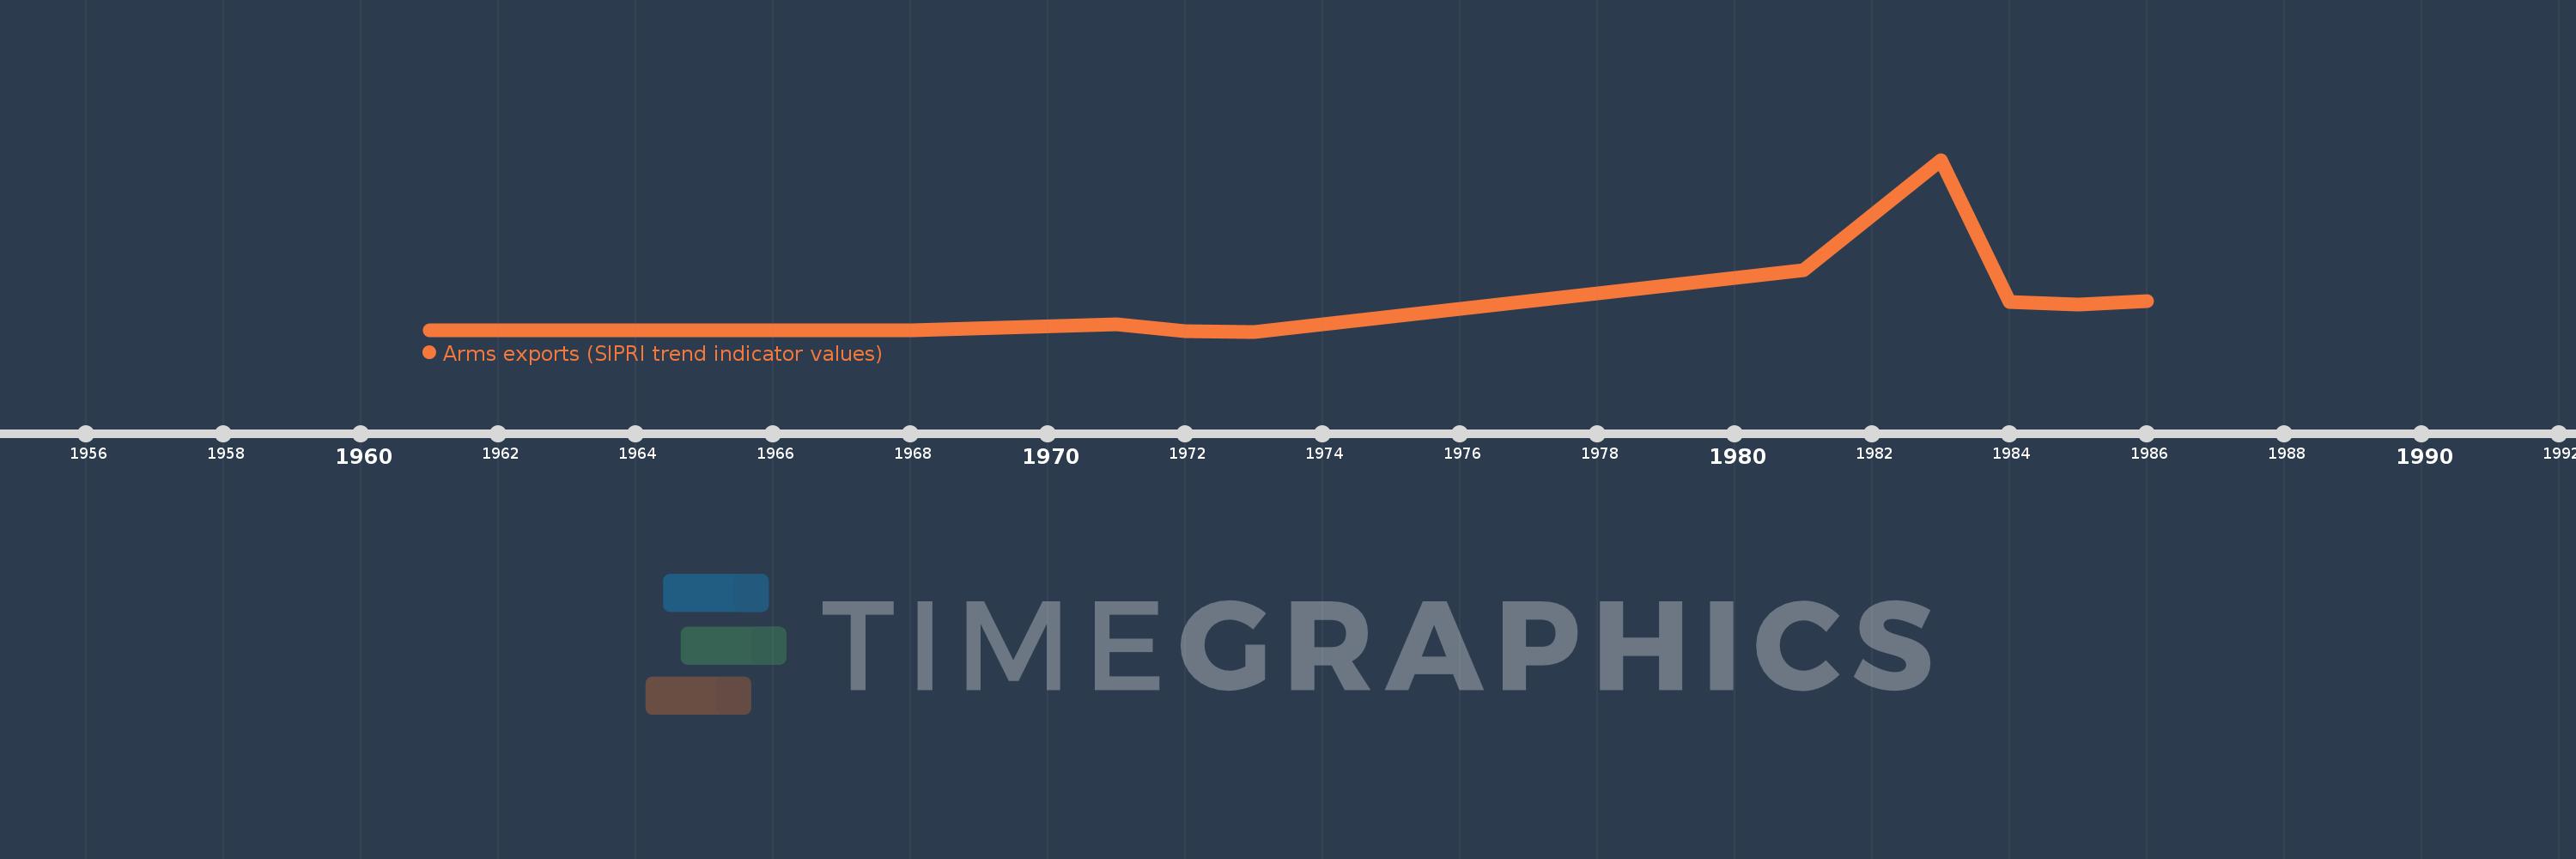
This timeline shows a graph from 1961 to 1986 of Fragile and conflict affected situations. No data until 1960. Number of actual observations by date: 11.
Source name:
World Development Indicators
Source organization:
Stockholm International Peace Research Institute (SIPRI), Arms Transfers Programme (http://portal.sipri.org/publications/pages/transfer/splash).
Categories, topics:
Public Sector, Trade
Last updated:
apr 23, 2017
Indicators value changes by year
Meaning:
60.727 mln
Minimum:
0.0
jan 1, 1973
Maximum:
346.0 mln
jan 1, 1983
At the date of observation
Value
Absolute change
Change from the previous value
jan 1, 1961
3.0 mln
+3.0 mln
0.0%
jan 1, 1965
3.0 mln
0.0
0.0%
jan 1, 1968
2.0 mln
-1000.0K
-33.33%
jan 1, 1971
14.0 mln
+12.0 mln
600.0%
jan 1, 1972
1000.0K
-13.0 mln
-92.86%
jan 1, 1973
0.0
-1000.0K
-100.0%
jan 1, 1981
123.0 mln
+123.0 mln
%
jan 1, 1983
346.0 mln
+223.0 mln
181.3%
jan 1, 1984
60.0 mln
-286.0 mln
-82.66%
jan 1, 1985
55.0 mln
-5.0 mln
-8.33%
jan 1, 1986
61.0 mln
+6.0 mln
10.91%
Ranking of countries by current statistics by years