33
/
AIzaSyB4mHJ5NPEv-XzF7P6NDYXjlkCWaeKw5bc
November 30, 2025
57881
South Asia (IDA & IBRD)
TSA
false
2
1
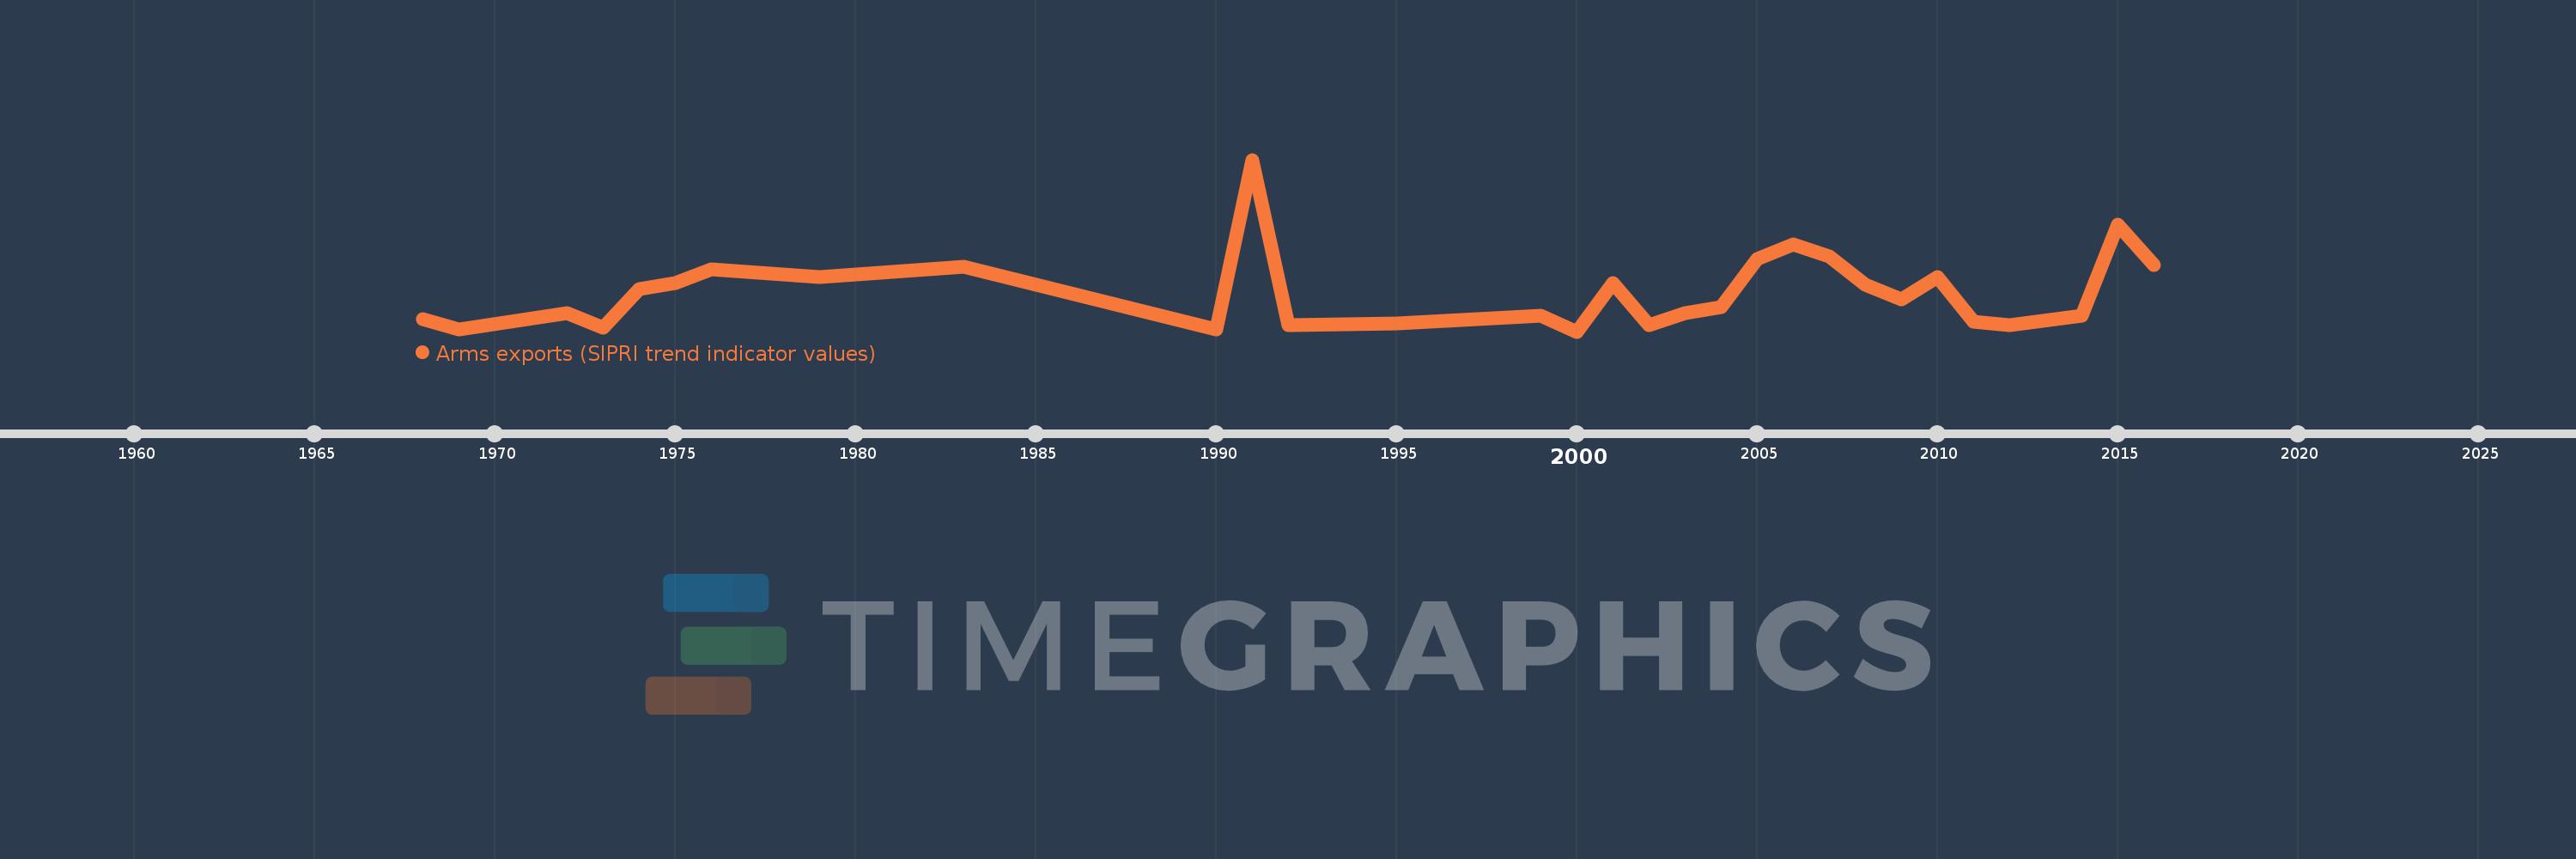
Arms exports (SIPRI trend indicator values)
2016,2015,2014,2012,2011,2010,2009,2008,2007,2006,2005,2004,2003,2002,2001,2000,1999,1995,1992,1991,1990,1983,1979,1976,1975,1974,1973,1972,1969,1968