33
/
AIzaSyB4mHJ5NPEv-XzF7P6NDYXjlkCWaeKw5bc
November 30, 2025
37165
IDA & IBRD total
IBT
false
2
1
Arms exports (SIPRI trend indicator values)
2016,2007,1969,1968,1962,1961
Create a timeline
Public Timelines
For education
For educational institutions
For teachers
For students
Cabinet
For educational institutions
For teachers
For students
Open cabinet
FAQ
Close
Create a timeline
Public timelines
FAQ
About & Feedback
Terms
Privacy
FAQ
Support 24/7
Cabinet
Get premium
Donate
Download
Global statistics library
→
IDA & IBRD total
→
Arms exports (SIPRI trend indicator values)
This statistics in other country:
Afghanistan
Albania
Algeria
Angola
Arab World
Argentina
Aruba
Australia
Austria
Bahamas, The
Bahrain
Bangladesh
Belarus
Belgium
Bosnia and Herzegovina
Botswana
Brazil
Brunei Darussalam
Bulgaria
Cambodia
Canada
Central Europe and the Baltics
Chad
Chile
China
Colombia
Congo, Dem. Rep.
Costa Rica
Cote d'Ivoire
Croatia
Cuba
Cyprus
Czech Republic
Denmark
Early-demographic dividend
East Asia & Pacific
East Asia & Pacific (excluding high income)
East Asia & Pacific (IDA & IBRD countries)
Ecuador
Egypt, Arab Rep.
El Salvador
Eritrea
Estonia
Ethiopia
Euro area
Europe & Central Asia
Europe & Central Asia (excluding high income)
Europe & Central Asia (IDA & IBRD countries)
European Union
Fiji
Finland
Fragile and conflict affected situations
France
Gabon
Georgia
Germany
Ghana
Greece
Guyana
Heavily indebted poor countries (HIPC)
High income
Hungary
IBRD only
Iceland
IDA & IBRD total
IDA blend
IDA only
IDA total
India
Indonesia
Iran, Islamic Rep.
Iraq
Ireland
Israel
Italy
Japan
Jordan
Kazakhstan
Kenya
Korea, Dem. People’s Rep.
Korea, Rep.
Kuwait
Kyrgyz Republic
Late-demographic dividend
Latin America & Caribbean
Latin America & Caribbean (excluding high income)
Latin America & the Caribbean (IDA & IBRD countries)
Latvia
Least developed countries: UN classification
Lebanon
Libya
Lithuania
Low & middle income
Low income
Lower middle income
Luxembourg
Macedonia, FYR
Malawi
Malaysia
Malta
Middle East & North Africa
Middle East & North Africa (excluding high income)
Middle East & North Africa (IDA & IBRD countries)
Middle income
Moldova
Montenegro
Morocco
Mozambique
Netherlands
New Zealand
Nicaragua
Niger
Nigeria
North America
Norway
OECD members
Oman
Pakistan
Panama
Peru
Philippines
Poland
Portugal
Post-demographic dividend
Pre-demographic dividend
Qatar
Romania
Russian Federation
Saudi Arabia
Senegal
Serbia
Seychelles
Singapore
Slovak Republic
South Africa
South Asia
South Asia (IDA & IBRD)
Spain
Sri Lanka
Sub-Saharan Africa
Sub-Saharan Africa (excluding high income)
Sub-Saharan Africa (IDA & IBRD countries)
Sudan
Sweden
Switzerland
Syrian Arab Republic
Thailand
Turkey
Uganda
Ukraine
United Arab Emirates
United Kingdom
United States
Upper middle income
Uruguay
Uzbekistan
Venezuela, RB
Vietnam
Yemen, Rep.
Zambia
Zimbabwe
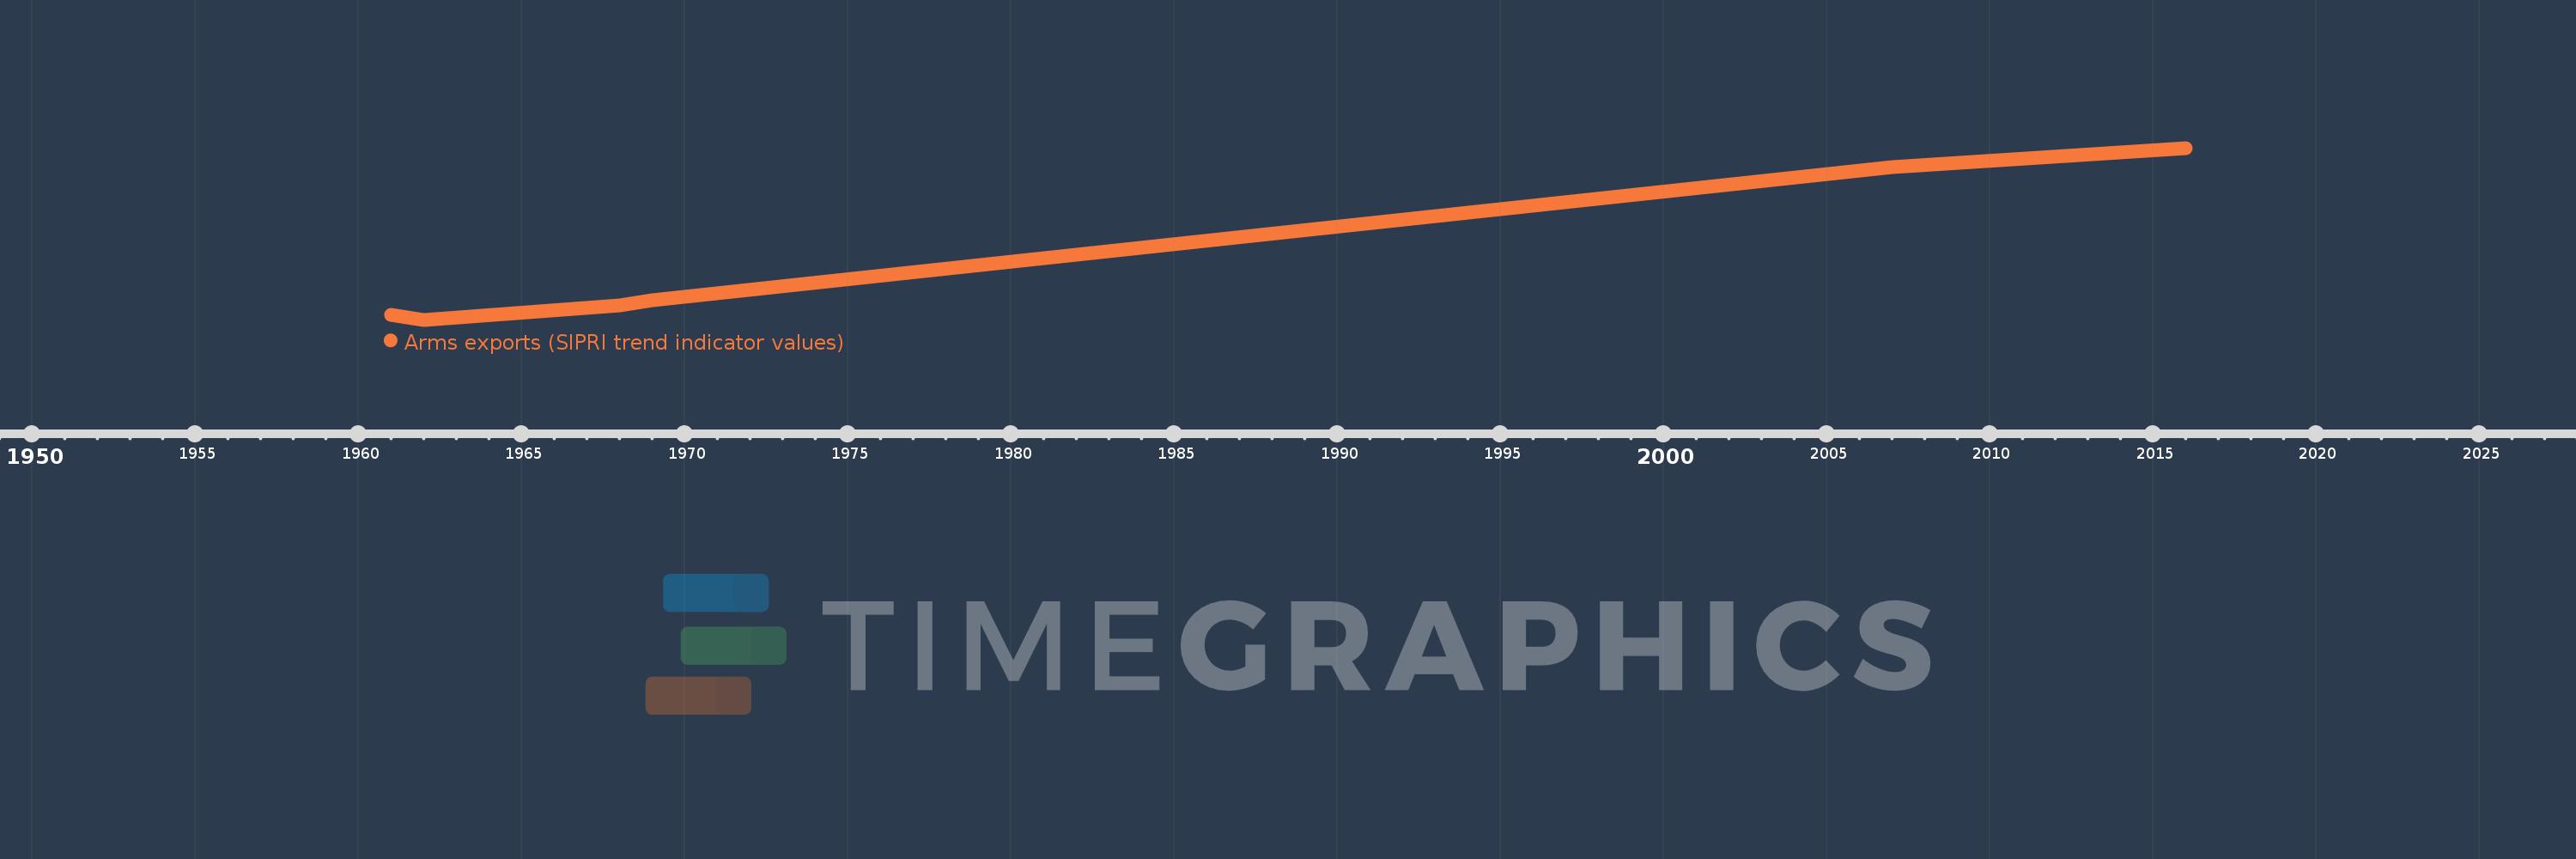
Timeline:
This timeline shows a graph from
1961
to
2016
of IDA & IBRD total. No data until
1960
. Number of actual observations by date:
6
.
Source name:
World Development Indicators
Source organization:
Stockholm International Peace Research Institute (SIPRI), Arms Transfers Programme (http://portal.sipri.org/publications/pages/transfer/splash).
Categories, topics:
Public Sector, Trade
Last updated:
apr 23, 2017
Indicators value changes by year
Meaning:
2.978 bln
Minimum:
85.0 mln
jan 1, 1962
Maximum:
8.301 bln
jan 1, 2016
At the date of observation
Value
Absolute change
Change from the previous value
jan 1, 1961
334.0 mln
+334.0 mln
0.0%
jan 1, 1962
85.0 mln
-249.0 mln
-74.55%
jan 1, 1968
759.0 mln
+674.0 mln
792.94%
jan 1, 1969
1.015 bln
+256.0 mln
33.73%
jan 1, 2007
7.375 bln
+6.36 bln
626.6%
jan 1, 2016
8.301 bln
+926.0 mln
12.56%
Ranking of countries by current statistics by years
About & Feedback
Terms
Privacy
FAQ
Support 24/7
Cabinet
Get premium
Donate
The service accepts bank transfer (ACH, Wire) or cards (Visa, MasterCard, etc). Processed by Stripe.
Secured with SSL