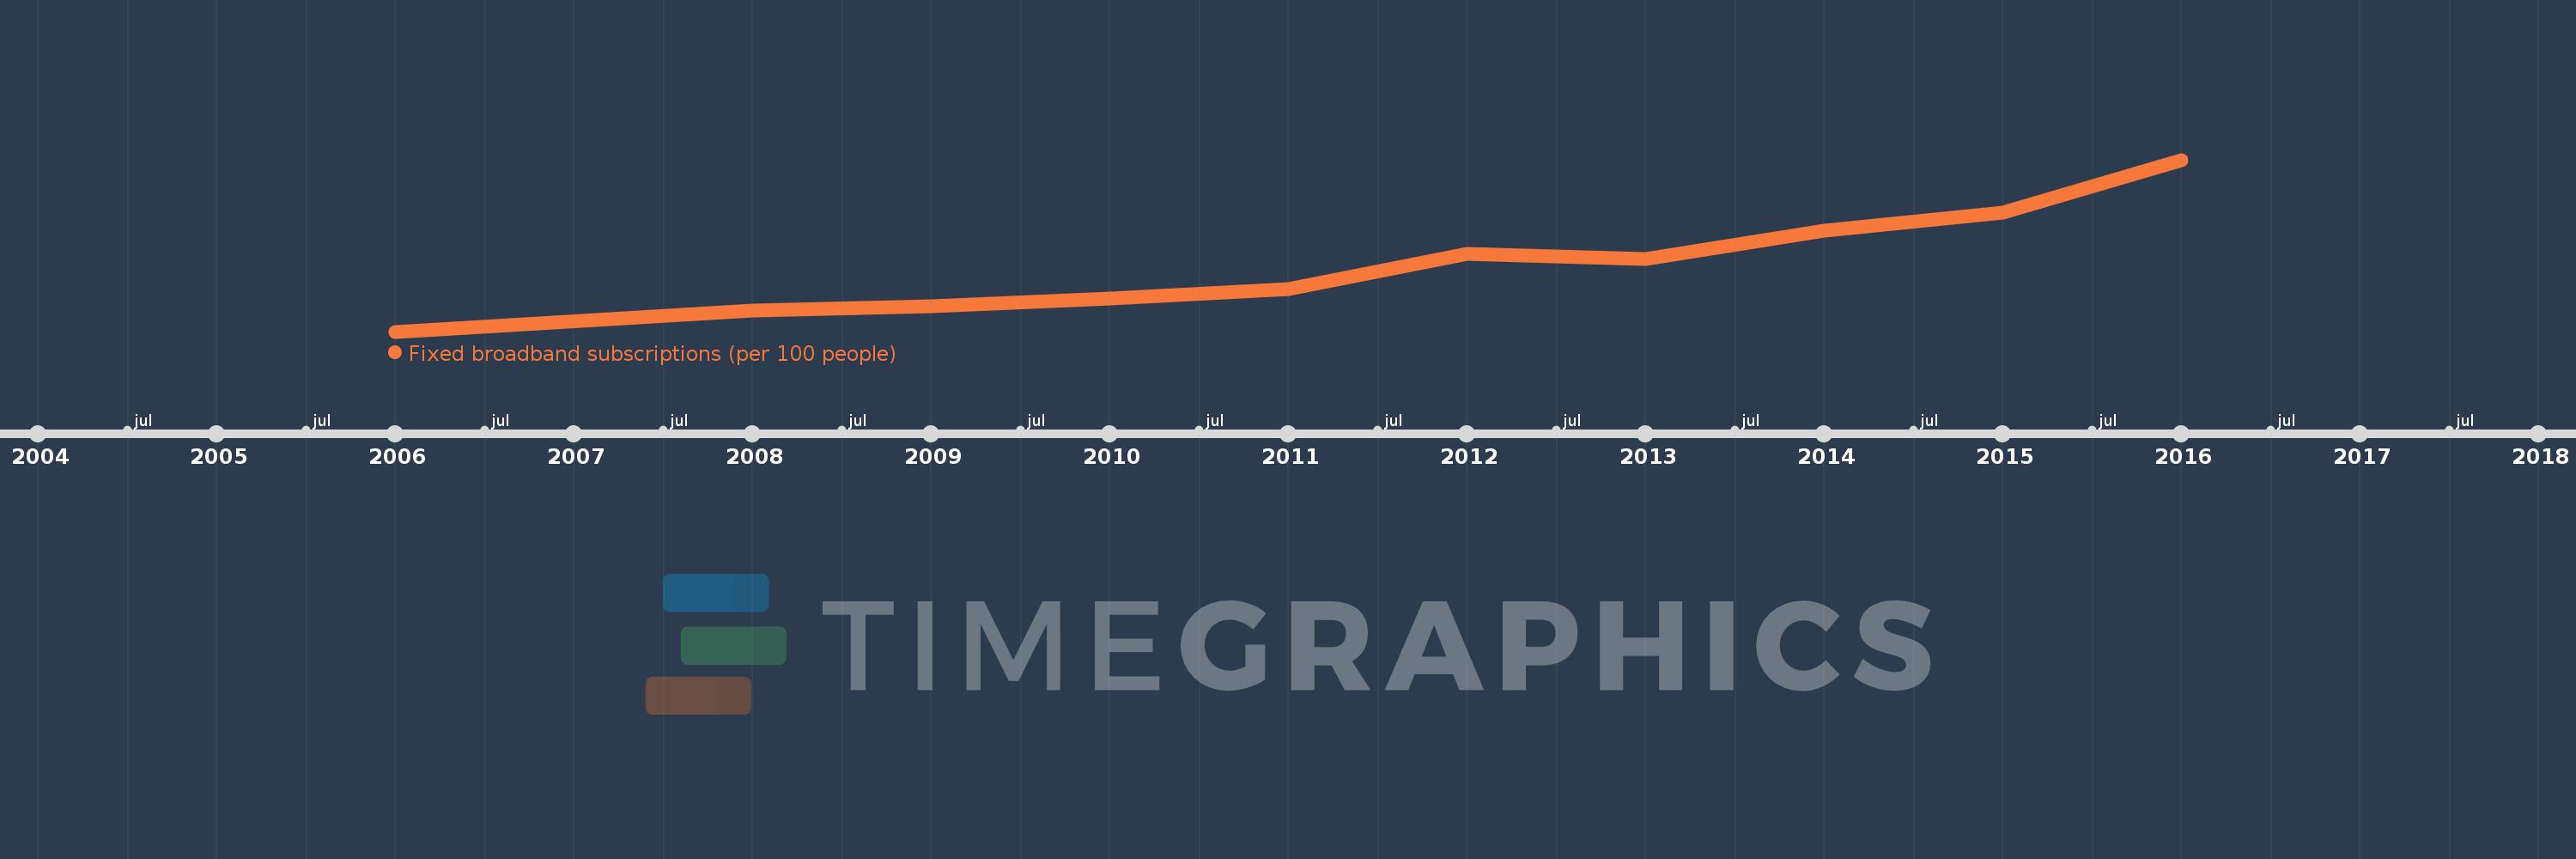
This timeline shows a graph from 2006 to 2016 of Sub-Saharan Africa (excluding high income). No data until 2005. Number of actual observations by date: 10.
Source name:
World Development Indicators
Source organization:
International Telecommunication Union, World Telecommunication/ICT Development Report and database.
Categories, topics:
Infrastructure
Last updated:
apr 23, 2017
Indicators value changes by year
Meaning:
0.23
Minimum:
0.039
jan 1, 2006
Maximum:
0.536
jan 1, 2016
At the date of observation
Value
Absolute change
Change from the previous value
jan 1, 2006
0.039
+0.039
0.0%
jan 1, 2008
0.099
+0.06
155.02%
jan 1, 2009
0.112
+0.013
13.23%
jan 1, 2010
0.134
+0.022
20.16%
jan 1, 2011
0.161
+0.027
19.83%
jan 1, 2012
0.263
+0.103
63.81%
jan 1, 2013
0.249
-0.014
-5.45%
jan 1, 2014
0.331
+0.082
32.9%
jan 1, 2015
0.382
+0.051
15.45%
jan 1, 2016
0.536
+0.154
40.4%
Ranking of countries by current statistics by years