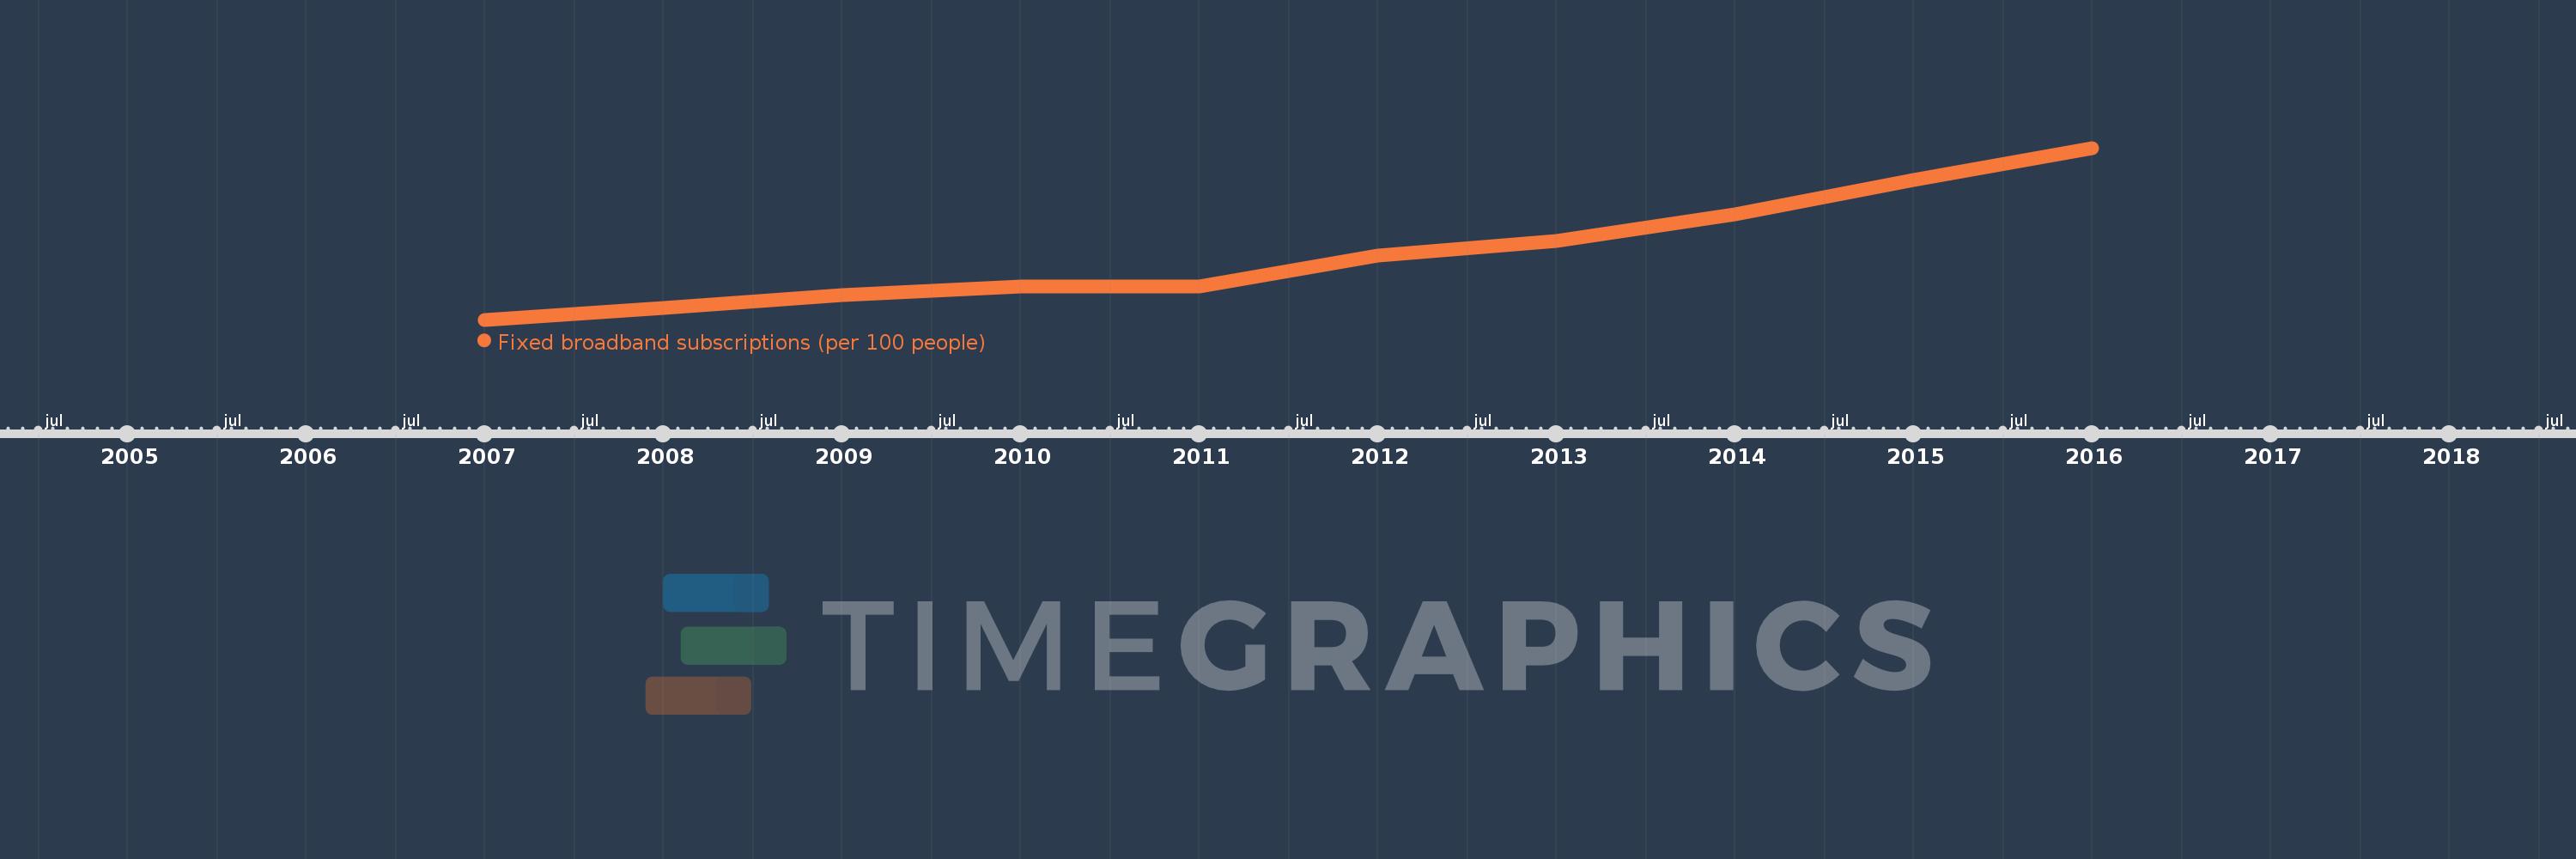
This timeline shows a graph from 2007 to 2016 of Heavily indebted poor countries (HIPC). No data until 2006. Number of actual observations by date: 10.
Source name:
World Development Indicators
Source organization:
International Telecommunication Union, World Telecommunication/ICT Development Report and database.
Categories, topics:
Infrastructure
Last updated:
apr 23, 2017
Indicators value changes by year
Meaning:
0.137
Minimum:
0.028
jan 1, 2007
Maximum:
0.31
jan 1, 2016
At the date of observation
Value
Absolute change
Change from the previous value
jan 1, 2007
0.028
+0.028
0.0%
jan 1, 2008
0.047
+0.019
69.37%
jan 1, 2009
0.068
+0.02
42.98%
jan 1, 2010
0.083
+0.015
22.02%
jan 1, 2011
0.083
+0.0
0.27%
jan 1, 2012
0.134
+0.051
62.06%
jan 1, 2013
0.157
+0.023
16.88%
jan 1, 2014
0.201
+0.044
28.1%
jan 1, 2015
0.258
+0.057
28.28%
jan 1, 2016
0.31
+0.052
20.29%
Ranking of countries by current statistics by years