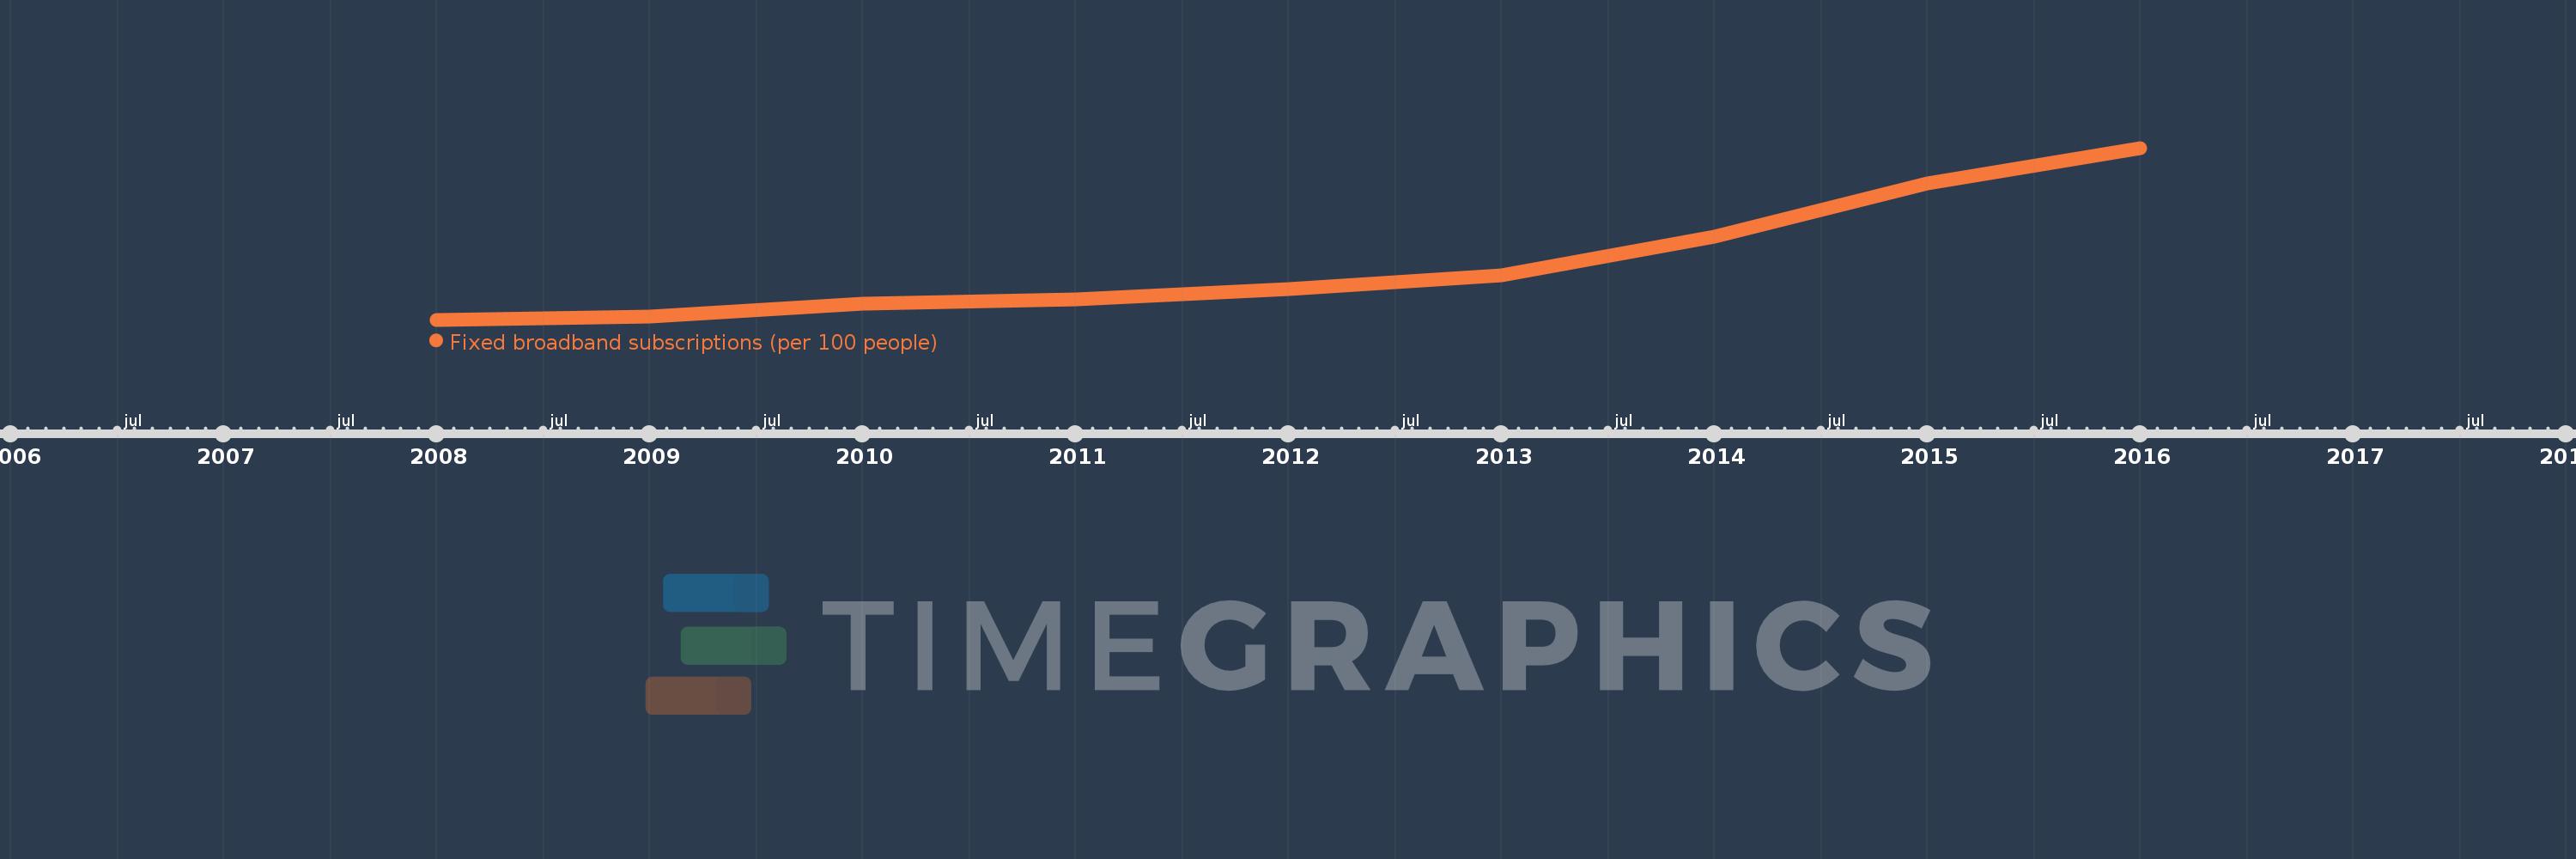
This timeline shows a graph from 2008 to 2016 of Least developed countries: UN classification. No data until 2007. Number of actual observations by date: 9.
Source name:
World Development Indicators
Source organization:
International Telecommunication Union, World Telecommunication/ICT Development Report and database.
Categories, topics:
Infrastructure
Last updated:
apr 23, 2017
Indicators value changes by year
Meaning:
0.251
Minimum:
0.033
jan 1, 2008
Maximum:
0.702
jan 1, 2016
At the date of observation
Value
Absolute change
Change from the previous value
jan 1, 2008
0.033
+0.033
0.0%
jan 1, 2009
0.044
+0.011
32.34%
jan 1, 2010
0.095
+0.051
116.92%
jan 1, 2011
0.111
+0.016
17.21%
jan 1, 2012
0.154
+0.043
38.33%
jan 1, 2013
0.205
+0.052
33.76%
jan 1, 2014
0.357
+0.151
73.71%
jan 1, 2015
0.563
+0.206
57.63%
jan 1, 2016
0.702
+0.139
24.75%
Ranking of countries by current statistics by years