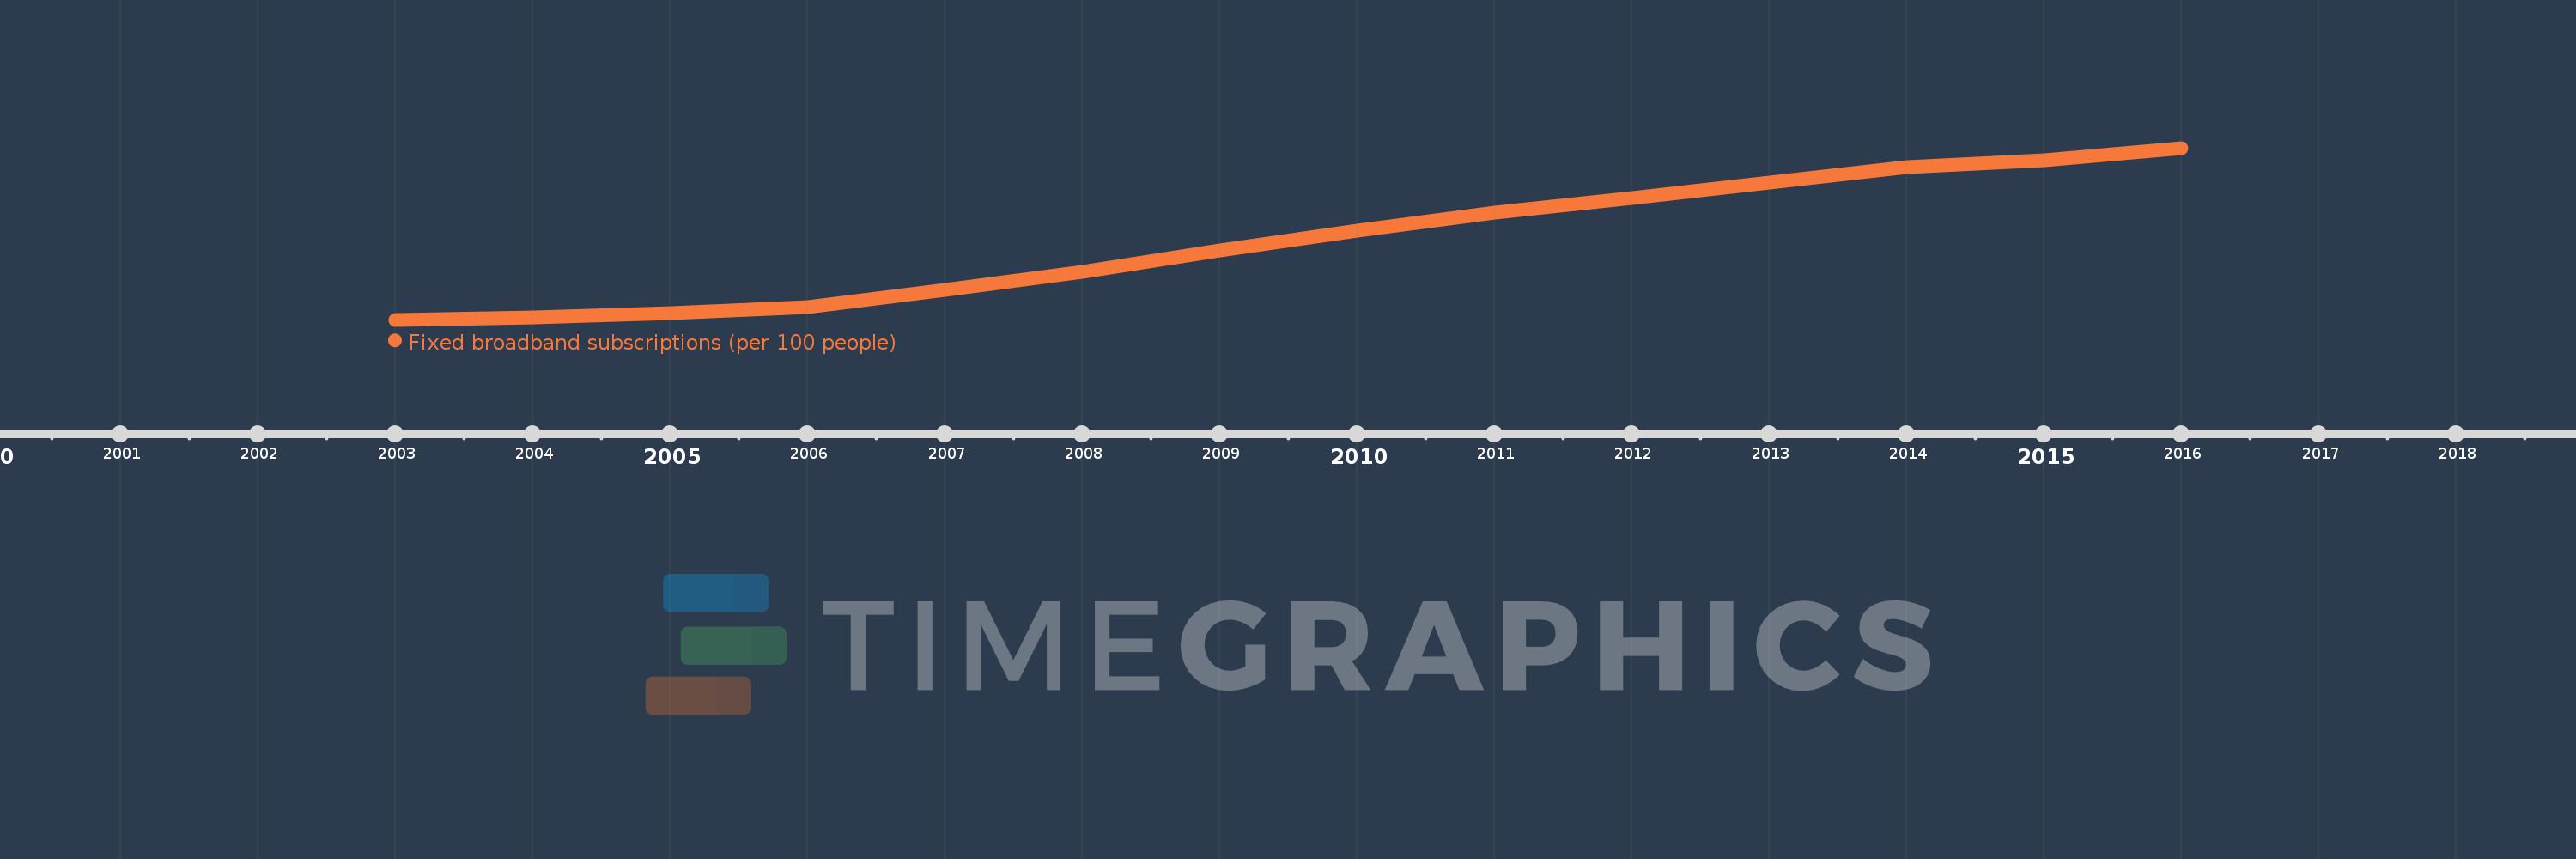
This timeline shows a graph from 2003 to 2016 of Europe & Central Asia (IDA & IBRD countries). No data until 2002. Number of actual observations by date: 14.
Source name:
World Development Indicators
Source organization:
International Telecommunication Union, World Telecommunication/ICT Development Report and database.
Categories, topics:
Infrastructure
Last updated:
apr 23, 2017
Indicators value changes by year
Meaning:
7.042
Minimum:
0.056
jan 1, 2003
Maximum:
15.228
jan 1, 2016
At the date of observation
Value
Absolute change
Change from the previous value
jan 1, 2003
0.056
+0.056
0.0%
jan 1, 2004
0.268
+0.212
381.72%
jan 1, 2005
0.646
+0.378
140.94%
jan 1, 2006
1.18
+0.534
82.74%
jan 1, 2007
2.66
+1.48
125.43%
jan 1, 2008
4.318
+1.658
62.35%
jan 1, 2009
6.168
+1.851
42.86%
jan 1, 2010
7.913
+1.745
28.29%
jan 1, 2011
9.484
+1.571
19.85%
jan 1, 2012
10.798
+1.314
13.85%
jan 1, 2013
12.17
+1.372
12.71%
jan 1, 2014
13.52
+1.351
11.1%
jan 1, 2015
14.177
+0.656
4.86%
jan 1, 2016
15.228
+1.051
7.41%
Ranking of countries by current statistics by years