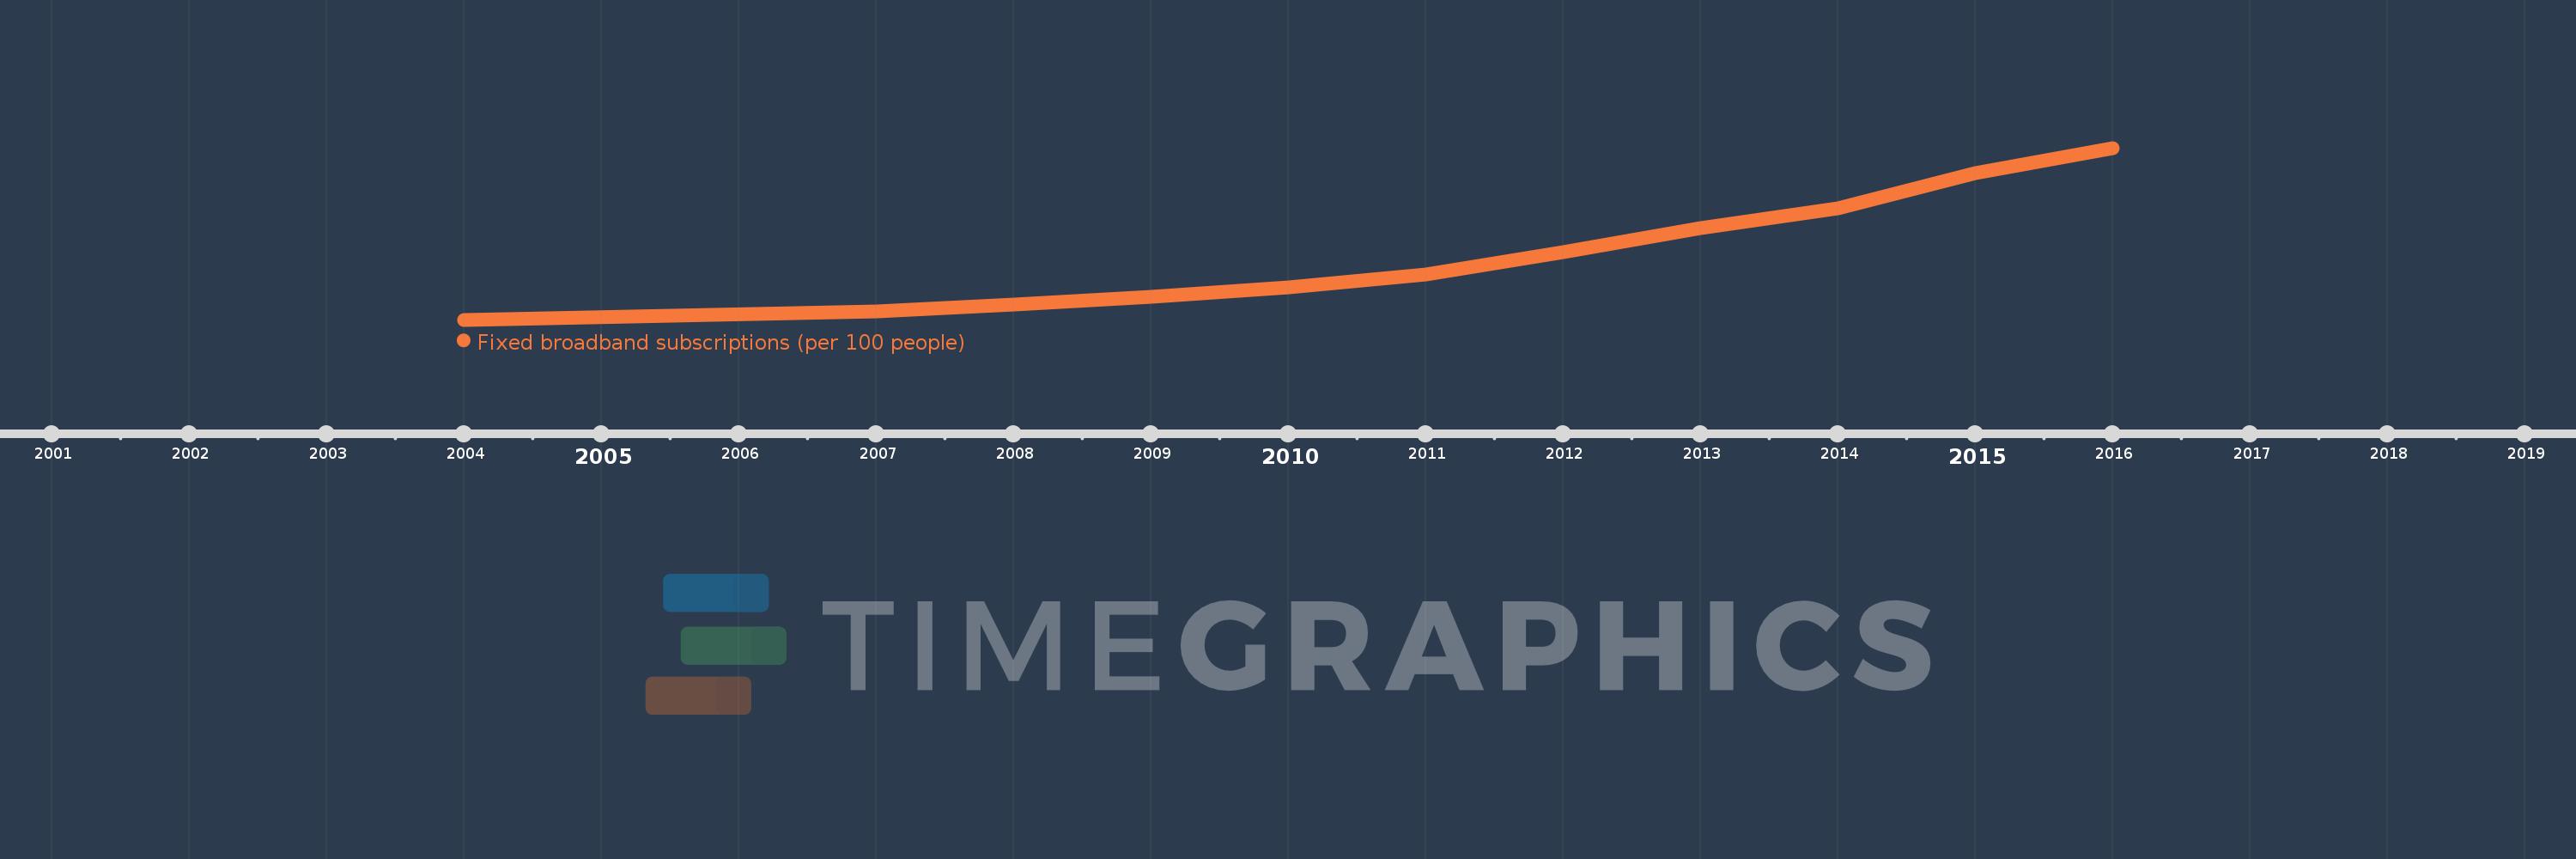
This timeline shows a graph from 2004 to 2016 of Middle East & North Africa (IDA & IBRD countries). No data until 2003. Number of actual observations by date: 11.
Source name:
World Development Indicators
Source organization:
International Telecommunication Union, World Telecommunication/ICT Development Report and database.
Categories, topics:
Infrastructure
Last updated:
apr 23, 2017
Indicators value changes by year
Meaning:
2.283
Minimum:
0.045
jan 1, 2004
Maximum:
5.981
jan 1, 2016
At the date of observation
Value
Absolute change
Change from the previous value
jan 1, 2004
0.045
+0.045
0.0%
jan 1, 2007
0.344
+0.299
657.2%
jan 1, 2008
0.561
+0.217
63.17%
jan 1, 2009
0.832
+0.27
48.18%
jan 1, 2010
1.172
+0.34
40.93%
jan 1, 2011
1.597
+0.425
36.3%
jan 1, 2012
2.381
+0.784
49.06%
jan 1, 2013
3.207
+0.826
34.71%
jan 1, 2014
3.886
+0.678
21.15%
jan 1, 2015
5.11
+1.225
31.52%
jan 1, 2016
5.981
+0.87
17.03%
Ranking of countries by current statistics by years