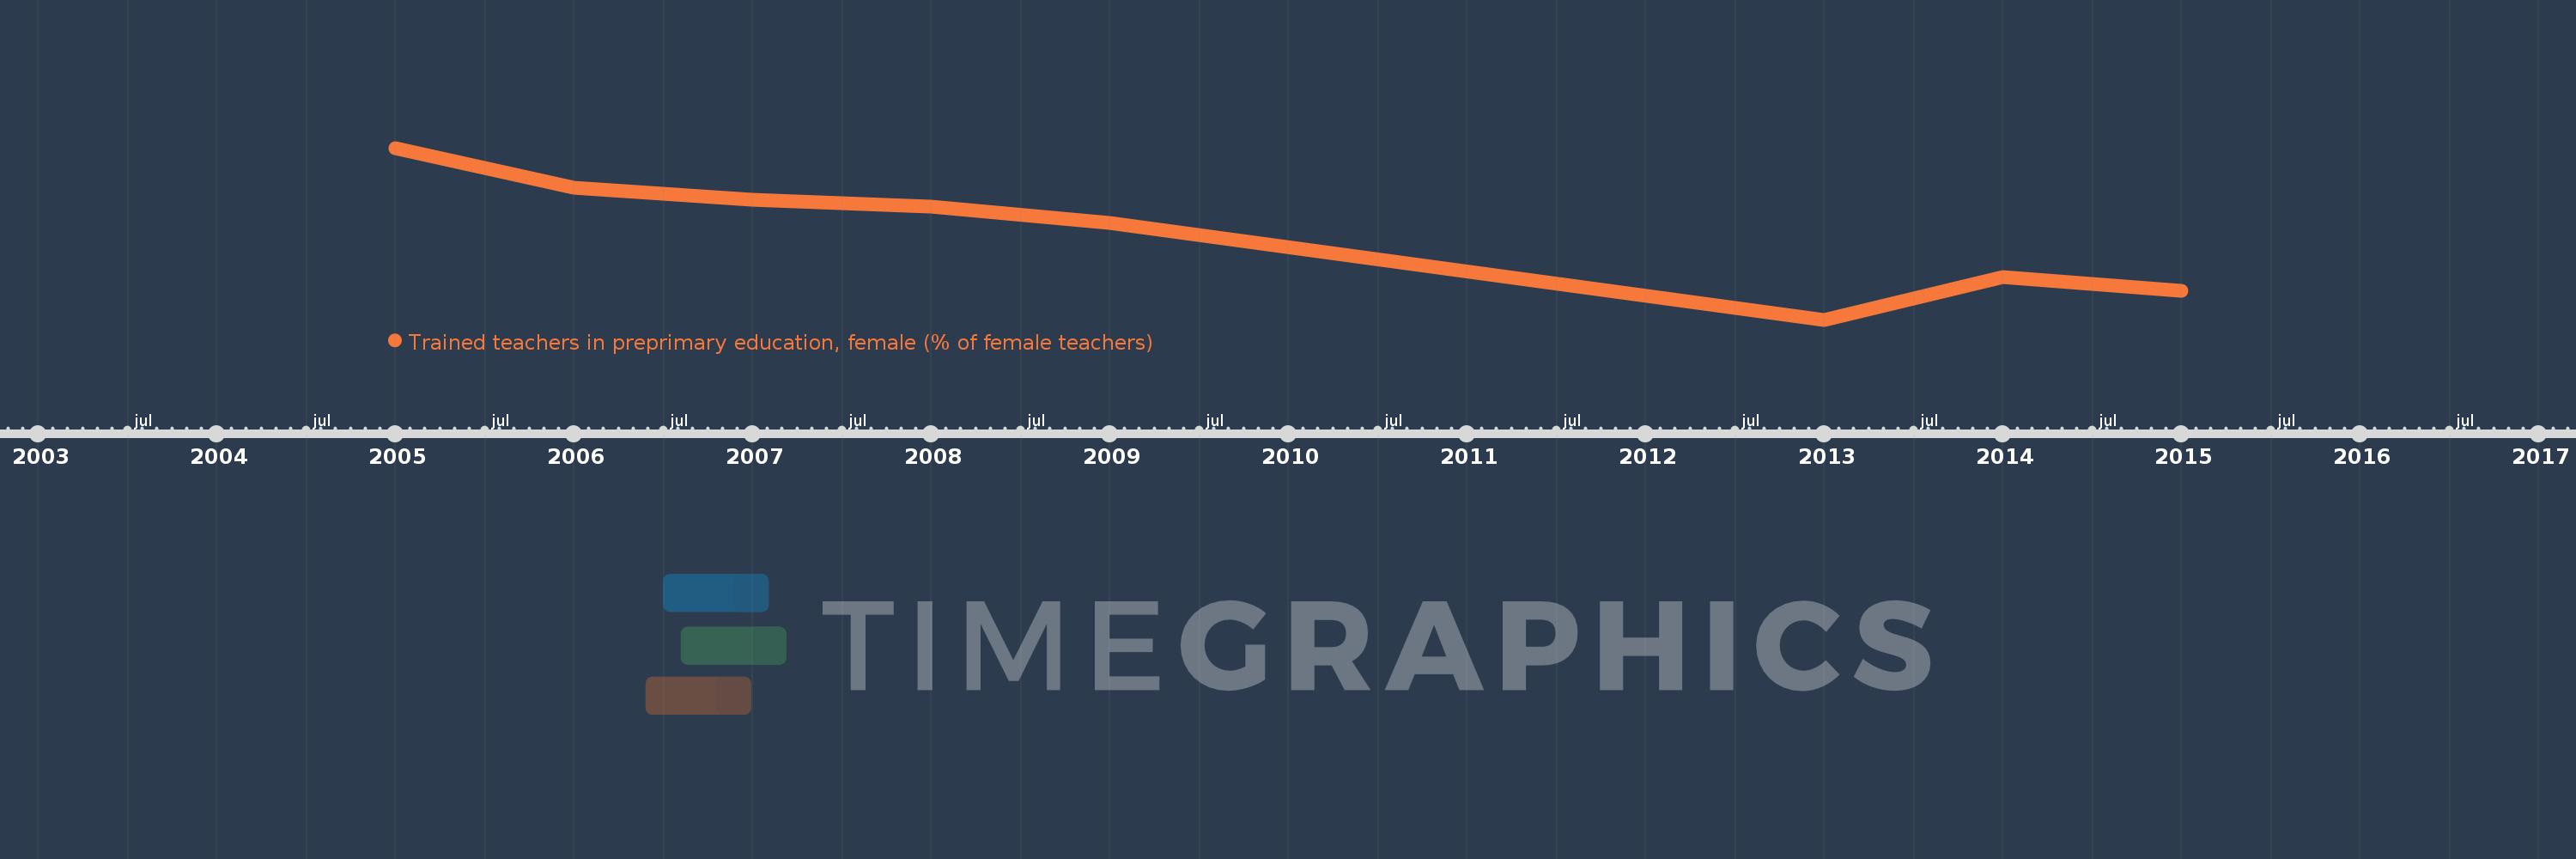
This timeline shows a graph from 2005 to 2015 of Middle East & North Africa (IDA & IBRD countries). No data until 2004. Number of actual observations by date: 8.
Source name:
World Development Indicators
Source organization:
United Nations Educational, Scientific, and Cultural Organization (UNESCO) Institute for Statistics.
Categories, topics:
Education
Last updated:
apr 23, 2017
Indicators value changes by year
Meaning:
82.658
Minimum:
71.114
jan 1, 2013
Maximum:
93.62
jan 1, 2005
At the date of observation
Value
Absolute change
Change from the previous value
jan 1, 2005
93.62
+93.62
0.0%
jan 1, 2006
88.454
-5.166
-5.52%
jan 1, 2007
86.801
-1.653
-1.87%
jan 1, 2008
85.966
-0.835
-0.96%
jan 1, 2009
83.761
-2.205
-2.56%
jan 1, 2013
71.114
-12.647
-15.1%
jan 1, 2014
76.692
+5.578
7.84%
jan 1, 2015
74.856
-1.836
-2.39%
Ranking of countries by current statistics by years