33
/
AIzaSyAYiBZKx7MnpbEhh9jyipgxe19OcubqV5w
August 1, 2025
100709
Cameroon
CMR
true
2
1
Trained teachers in preprimary education, female (% of female teachers)
2013,2012,2011,2008,2007
Download
Global statistics library →Cameroon →

Trained teachers in preprimary education, female (% of female teachers)

This statistics in other country:

AndorraAngolaAntigua and BarbudaArab WorldArmeniaArubaAzerbaijanBahamas, TheBahrainBarbadosBelarusBelizeBeninBermudaBhutanBoliviaBotswanaBritish Virgin IslandsBrunei DarussalamBurkina FasoBurundiCabo VerdeCambodiaCameroonCaribbean small statesCayman IslandsChadColombiaCongo, Dem. Rep.Congo, Rep.Costa RicaCote d'IvoireCroatiaCubaDjiboutiDominicaDominican RepublicEcuadorEgypt, Arab Rep.El SalvadorEritreaEthiopiaFragile and conflict affected situationsGambia, TheGeorgiaGhanaGibraltarGrenadaGuineaGuinea-BissauGuyanaHeavily indebted poor countries (HIPC)HondurasIDA blendIDA onlyIDA totalIraqKazakhstanKenyaKuwaitKyrgyz RepublicLao PDRLeast developed countries: UN classificationLebanonLiberiaLow incomeMacao SAR, ChinaMadagascarMalaysiaMaldivesMaliMarshall IslandsMauritaniaMauritiusMiddle East & North AfricaMiddle East & North Africa (excluding high income)Middle East & North Africa (IDA & IBRD countries)MoldovaMongoliaMoroccoMyanmarNamibiaNauruNepalNicaraguaNigerOmanOther small statesPacific island small statesPanamaParaguayPre-demographic dividendQatarRwandaSamoaSao Tome and PrincipeSaudi ArabiaSenegalSerbiaSeychellesSierra LeoneSmall statesSolomon IslandsSouth AfricaSouth SudanSt. Kitts and NevisSt. LuciaSt. Vincent and the GrenadinesSub-Saharan Africa Sub-Saharan Africa (excluding high income)Sub-Saharan Africa (IDA & IBRD countries)SurinameSwazilandSyrian Arab RepublicTajikistanTanzaniaTogoTongaTrinidad and TobagoTuvaluUnited Arab EmiratesUzbekistanVietnamWest Bank and GazaZimbabwe

Timeline:

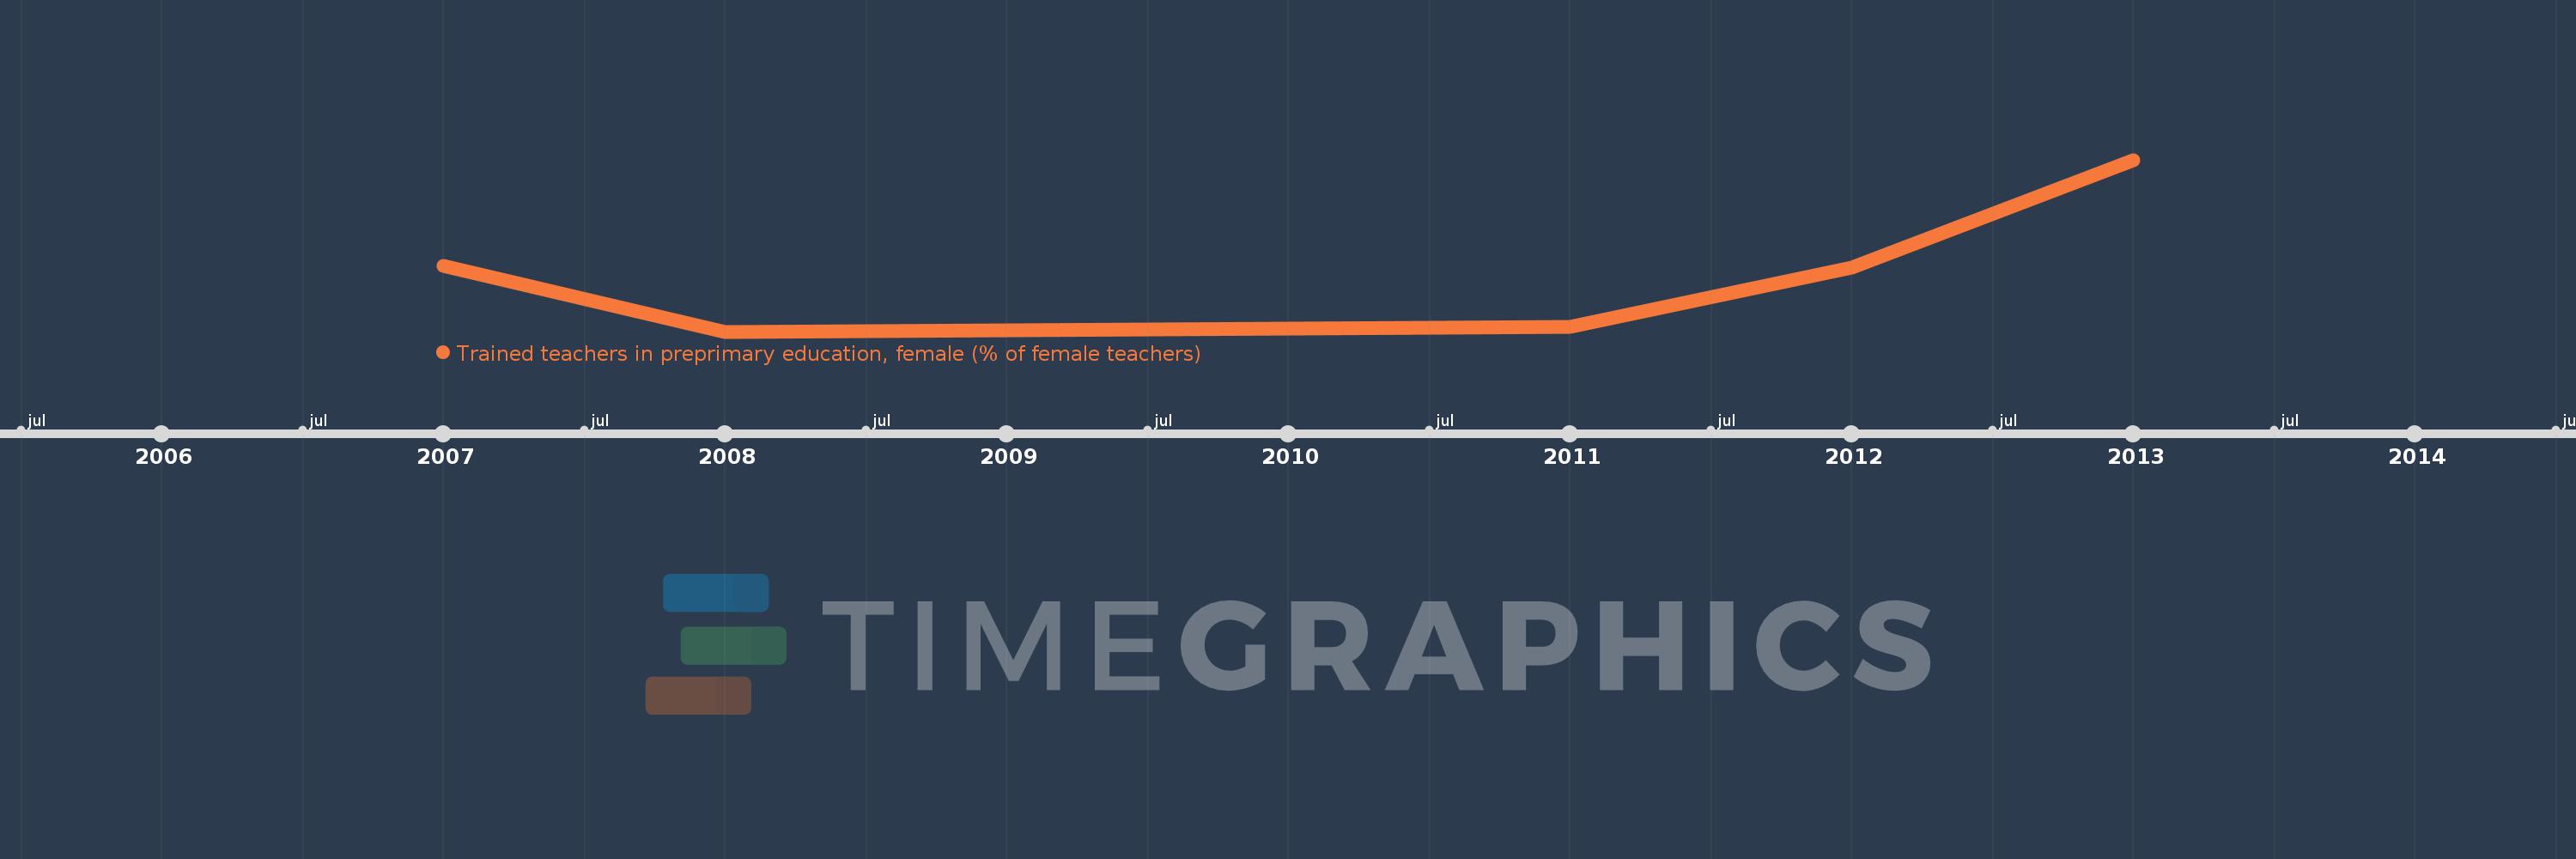
This timeline shows a graph from 2007 to 2013 of Cameroon. No data until 2006. Number of actual observations by date: 5.

Source name:

World Development Indicators

Source organization:

United Nations Educational, Scientific, and Cultural Organization (UNESCO) Institute for Statistics.

Categories, topics:

Education

Last updated:

apr 23, 2017

Indicators value changes by year

Meaning:
48.02
Minimum:
42.922
jan 1, 2008
Maximum:
57.201
jan 1, 2013
At the date of observation
Value
Absolute change
Change from the previous value
jan 1, 2007
48.419
+48.419
0.0%
jan 1, 2008
42.922
-5.497
-11.35%
jan 1, 2011
43.302
+0.38
0.89%
jan 1, 2012
48.258
+4.956
11.45%
jan 1, 2013
57.201
+8.943
18.53%

Ranking of countries by current statistics by years