Download This statistics in other country:
Timeline:
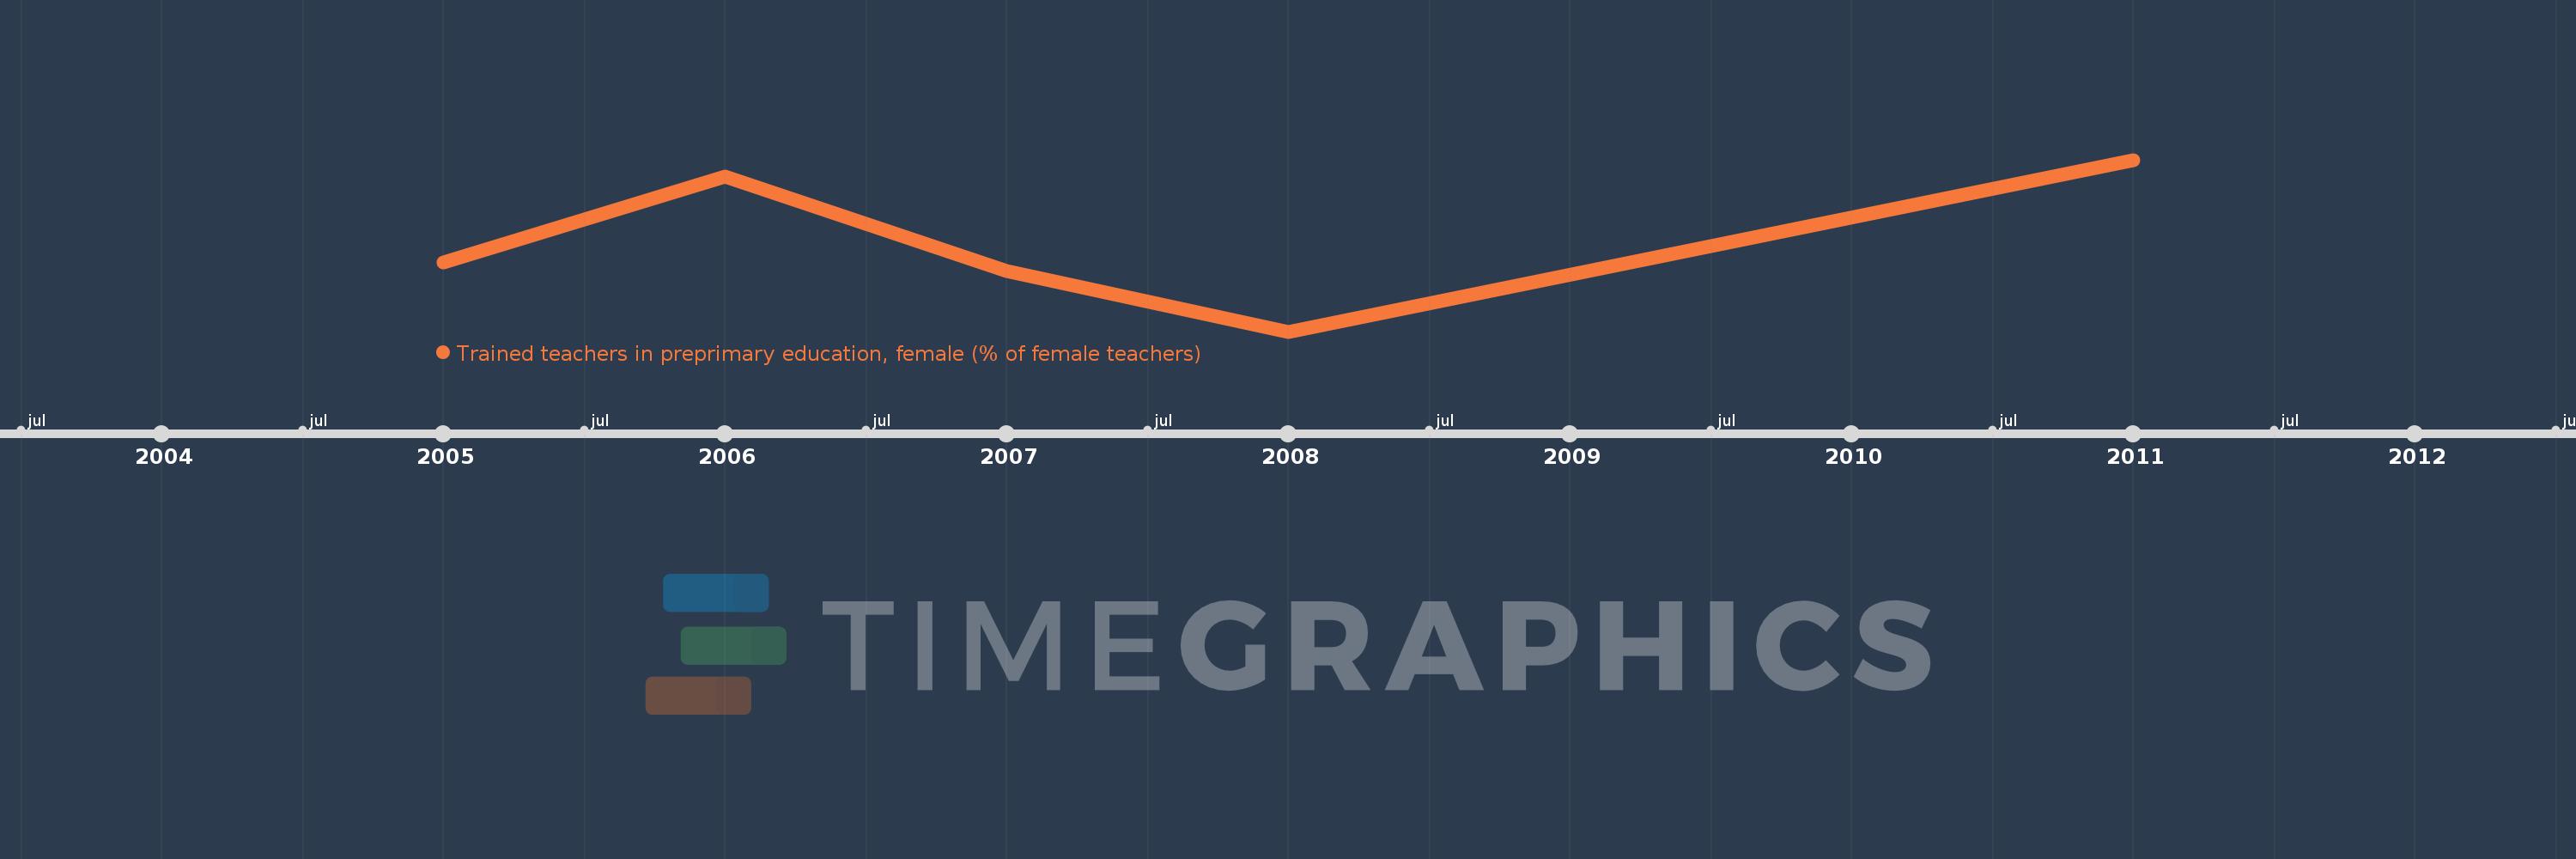
This timeline shows a graph from 2005 to 2011 of Tanzania. No data until 2004. Number of actual observations by date: 5.
Source name:
World Development Indicators
Source organization:
United Nations Educational, Scientific, and Cultural Organization (UNESCO) Institute for Statistics.
Categories, topics:
Education
Last updated:
apr 23, 2017
Indicators value changes by year
Minimum:
19.102
jan 1, 2008
Maximum:
27.848
jan 1, 2011
At the date of observation
Value
Absolute change
Change from the previous value
jan 1, 2005
22.629
+22.629
0.0%
jan 1, 2006
26.974
+4.345
19.2%
jan 1, 2007
22.203
-4.771
-17.69%
jan 1, 2008
19.102
-3.101
-13.97%
jan 1, 2011
27.848
+8.746
45.78%
Ranking of countries by current statistics by years