29
/
en
AIzaSyAYiBZKx7MnpbEhh9jyipgxe19OcubqV5w
April 1, 2024
44730
Least developed countries: UN classification
LDC
false
2
1
Trained teachers in preprimary education, female (% of female teachers)
2014,2013,2012,2011,2010
Download
Global statistics library →Least developed countries: UN classification →

Trained teachers in preprimary education, female (% of female teachers)

This statistics in other country:
AndorraAngolaAntigua and BarbudaArab WorldArmeniaArubaAzerbaijanBahamas, TheBahrainBarbadosBelarusBelizeBeninBermudaBhutanBoliviaBotswanaBritish Virgin IslandsBrunei DarussalamBurkina FasoBurundiCabo VerdeCambodiaCameroonCaribbean small statesCayman IslandsChadColombiaCongo, Dem. Rep.Congo, Rep.Costa RicaCote d'IvoireCroatiaCubaDjiboutiDominicaDominican RepublicEcuadorEgypt, Arab Rep.El SalvadorEritreaEthiopiaFragile and conflict affected situationsGambia, TheGeorgiaGhanaGibraltarGrenadaGuineaGuinea-BissauGuyanaHeavily indebted poor countries (HIPC)HondurasIDA blendIDA onlyIDA totalIraqKazakhstanKenyaKuwaitKyrgyz RepublicLao PDRLeast developed countries: UN classificationLebanonLiberiaLow incomeMacao SAR, ChinaMadagascarMalaysiaMaldivesMaliMarshall IslandsMauritaniaMauritiusMiddle East & North AfricaMiddle East & North Africa (excluding high income)Middle East & North Africa (IDA & IBRD countries)MoldovaMongoliaMoroccoMyanmarNamibiaNauruNepalNicaraguaNigerOmanOther small statesPacific island small statesPanamaParaguayPre-demographic dividendQatarRwandaSamoaSao Tome and PrincipeSaudi ArabiaSenegalSerbiaSeychellesSierra LeoneSmall statesSolomon IslandsSouth AfricaSouth SudanSt. Kitts and NevisSt. LuciaSt. Vincent and the GrenadinesSub-Saharan Africa Sub-Saharan Africa (excluding high income)Sub-Saharan Africa (IDA & IBRD countries)SurinameSwazilandSyrian Arab RepublicTajikistanTanzaniaTogoTongaTrinidad and TobagoTuvaluUnited Arab EmiratesUzbekistanVietnamWest Bank and GazaZimbabwe
Timeline:
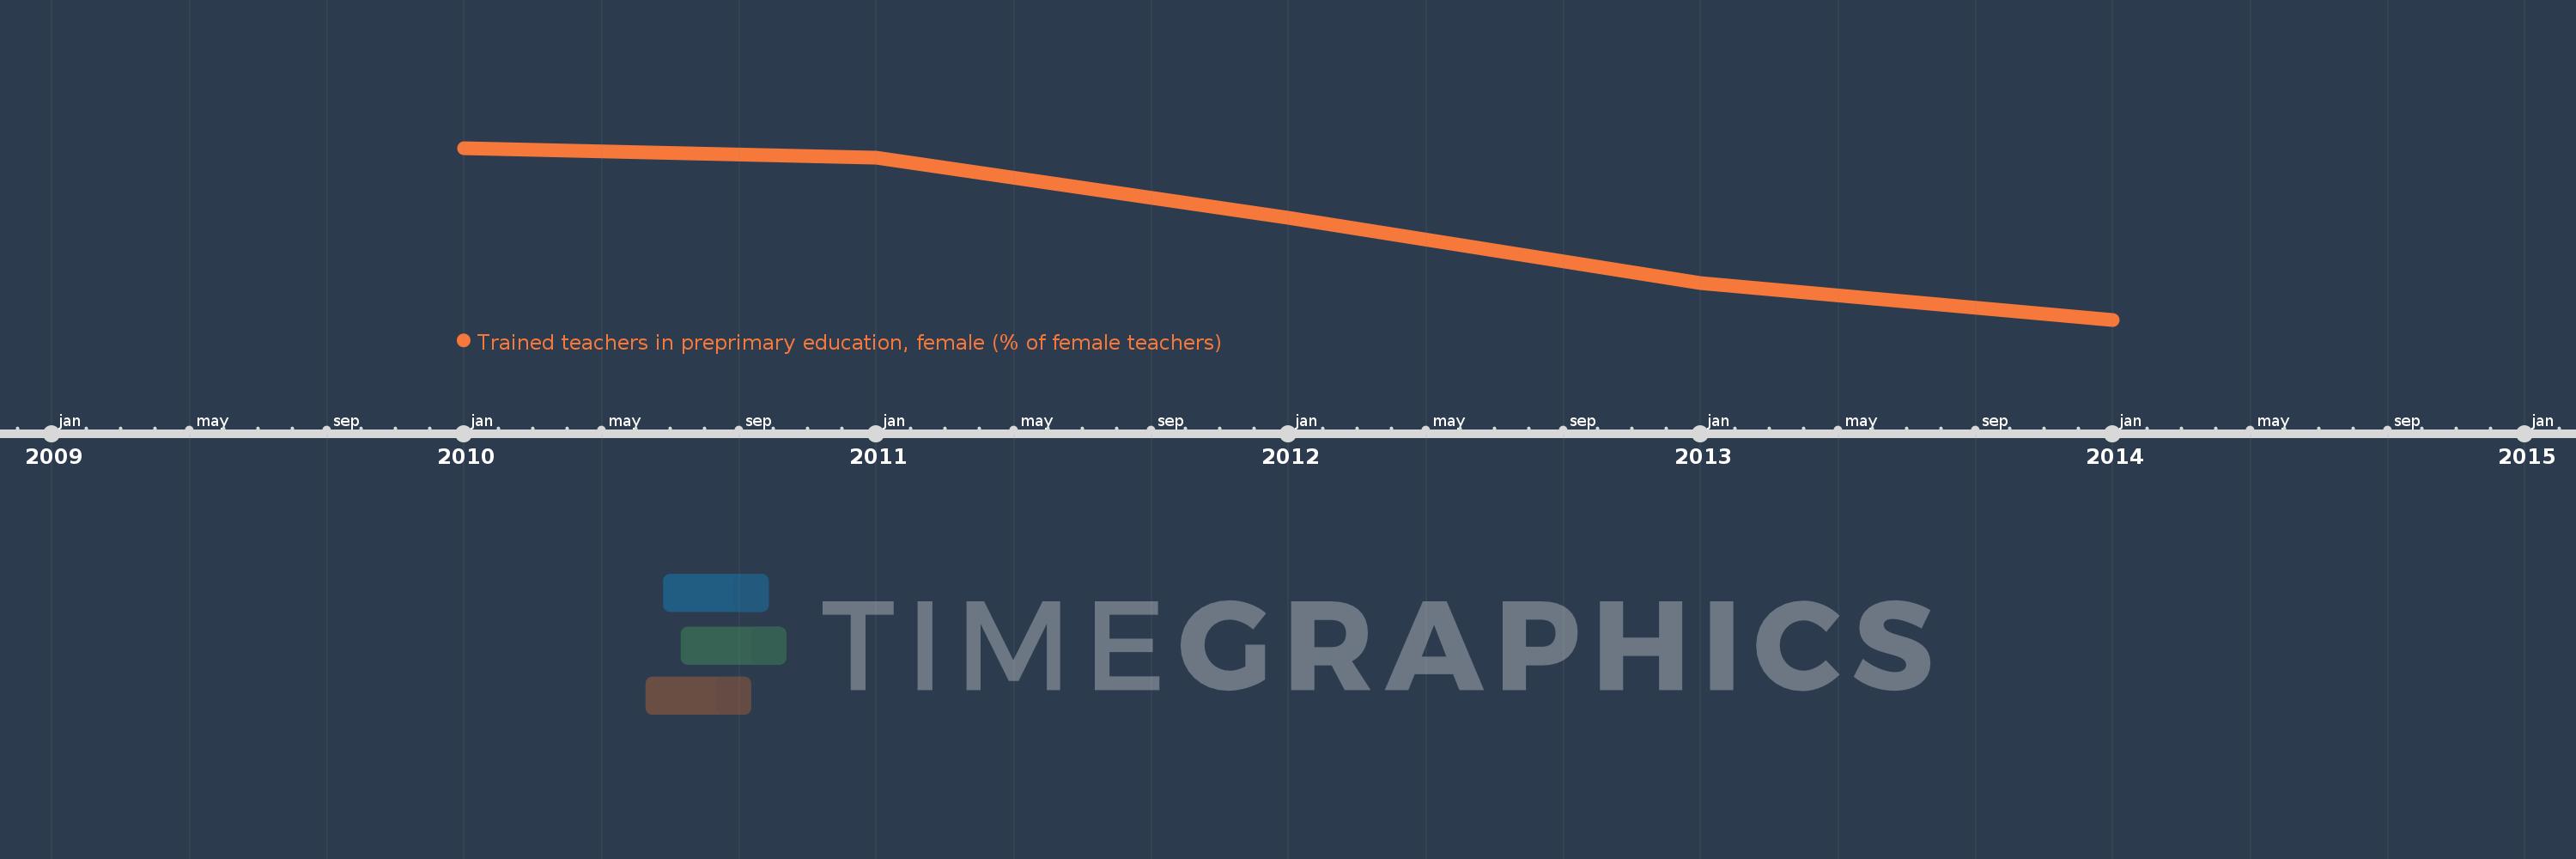
This timeline shows a graph from 2010 to 2014 of Least developed countries: UN classification. No data until 2009. Number of actual observations by date: 5.
Source name:
World Development Indicators
Source organization:
United Nations Educational, Scientific, and Cultural Organization (UNESCO) Institute for Statistics.
Categories, topics:
Education
Last updated:
apr 23, 2017
Indicators value changes by year
Mean:
58.283
Minimum:
51.368
jan 1, 2014
Maximum:
63.95
jan 1, 2010
At the date of observation
Value
Absolute change
Change from previous value
jan 1, 2010
63.95
+63.95
0.0%
jan 1, 2011
63.216
-0.733
-1.15%
jan 1, 2012
58.857
-4.36
-6.9%
jan 1, 2013
54.023
-4.834
-8.21%
jan 1, 2014
51.368
-2.655
-4.91%
Ranking of countries by current statistics by years

Comments:

Send
PremiumAbout & FeedbackTermsPrivacy
logo
© 2022 Selected Technologies LLC – Morgan Hill, California