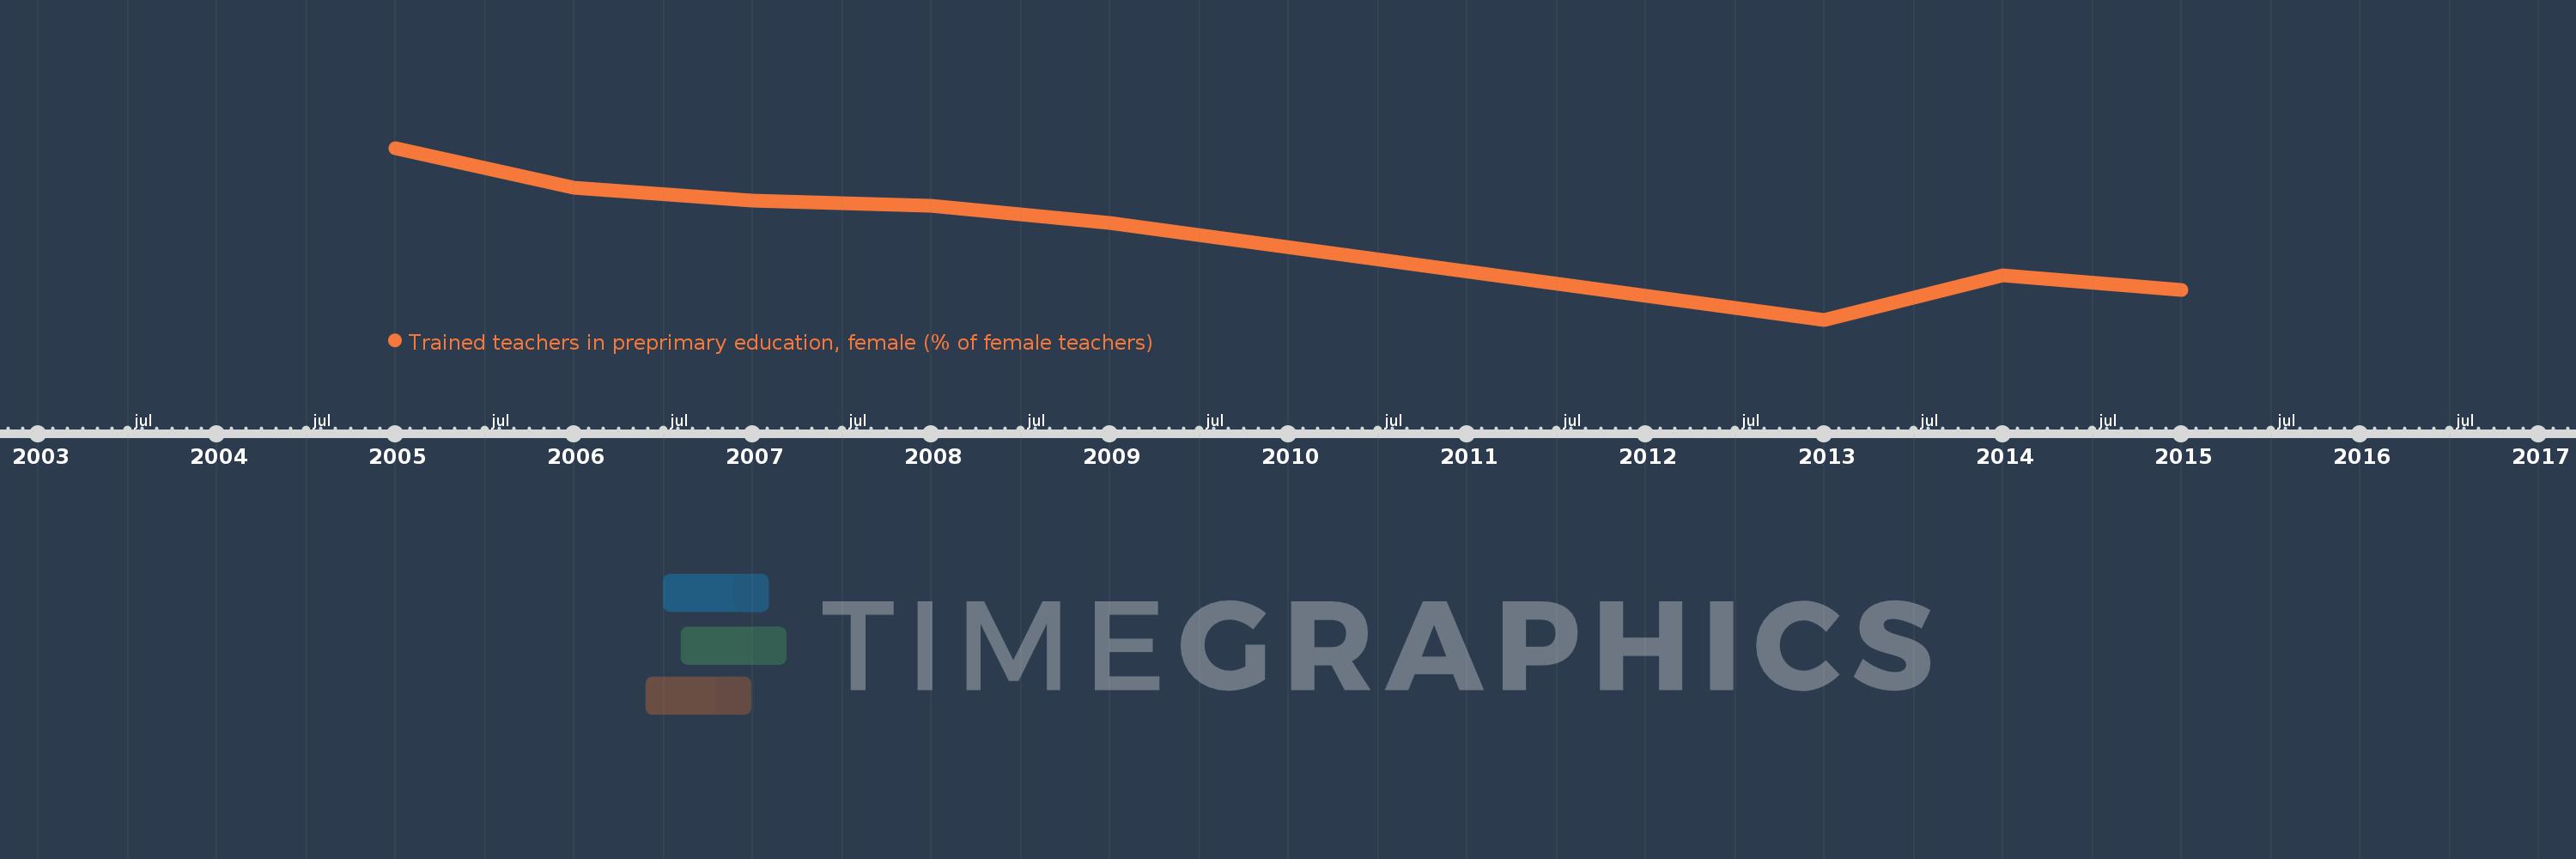
This timeline shows a graph from 2005 to 2015 of Middle East & North Africa (excluding high income). No data until 2004. Number of actual observations by date: 8.
Source name:
World Development Indicators
Source organization:
United Nations Educational, Scientific, and Cultural Organization (UNESCO) Institute for Statistics.
Categories, topics:
Education
Last updated:
apr 23, 2017
Indicators value changes by year
Meaning:
83.268
Minimum:
72.082
jan 1, 2013
Maximum:
93.799
jan 1, 2005
At the date of observation
Value
Absolute change
Change from the previous value
jan 1, 2005
93.799
+93.799
0.0%
jan 1, 2006
88.774
-5.026
-5.36%
jan 1, 2007
87.157
-1.617
-1.82%
jan 1, 2008
86.456
-0.701
-0.8%
jan 1, 2009
84.346
-2.11
-2.44%
jan 1, 2013
72.082
-12.264
-14.54%
jan 1, 2014
77.647
+5.565
7.72%
jan 1, 2015
75.879
-1.768
-2.28%
Ranking of countries by current statistics by years