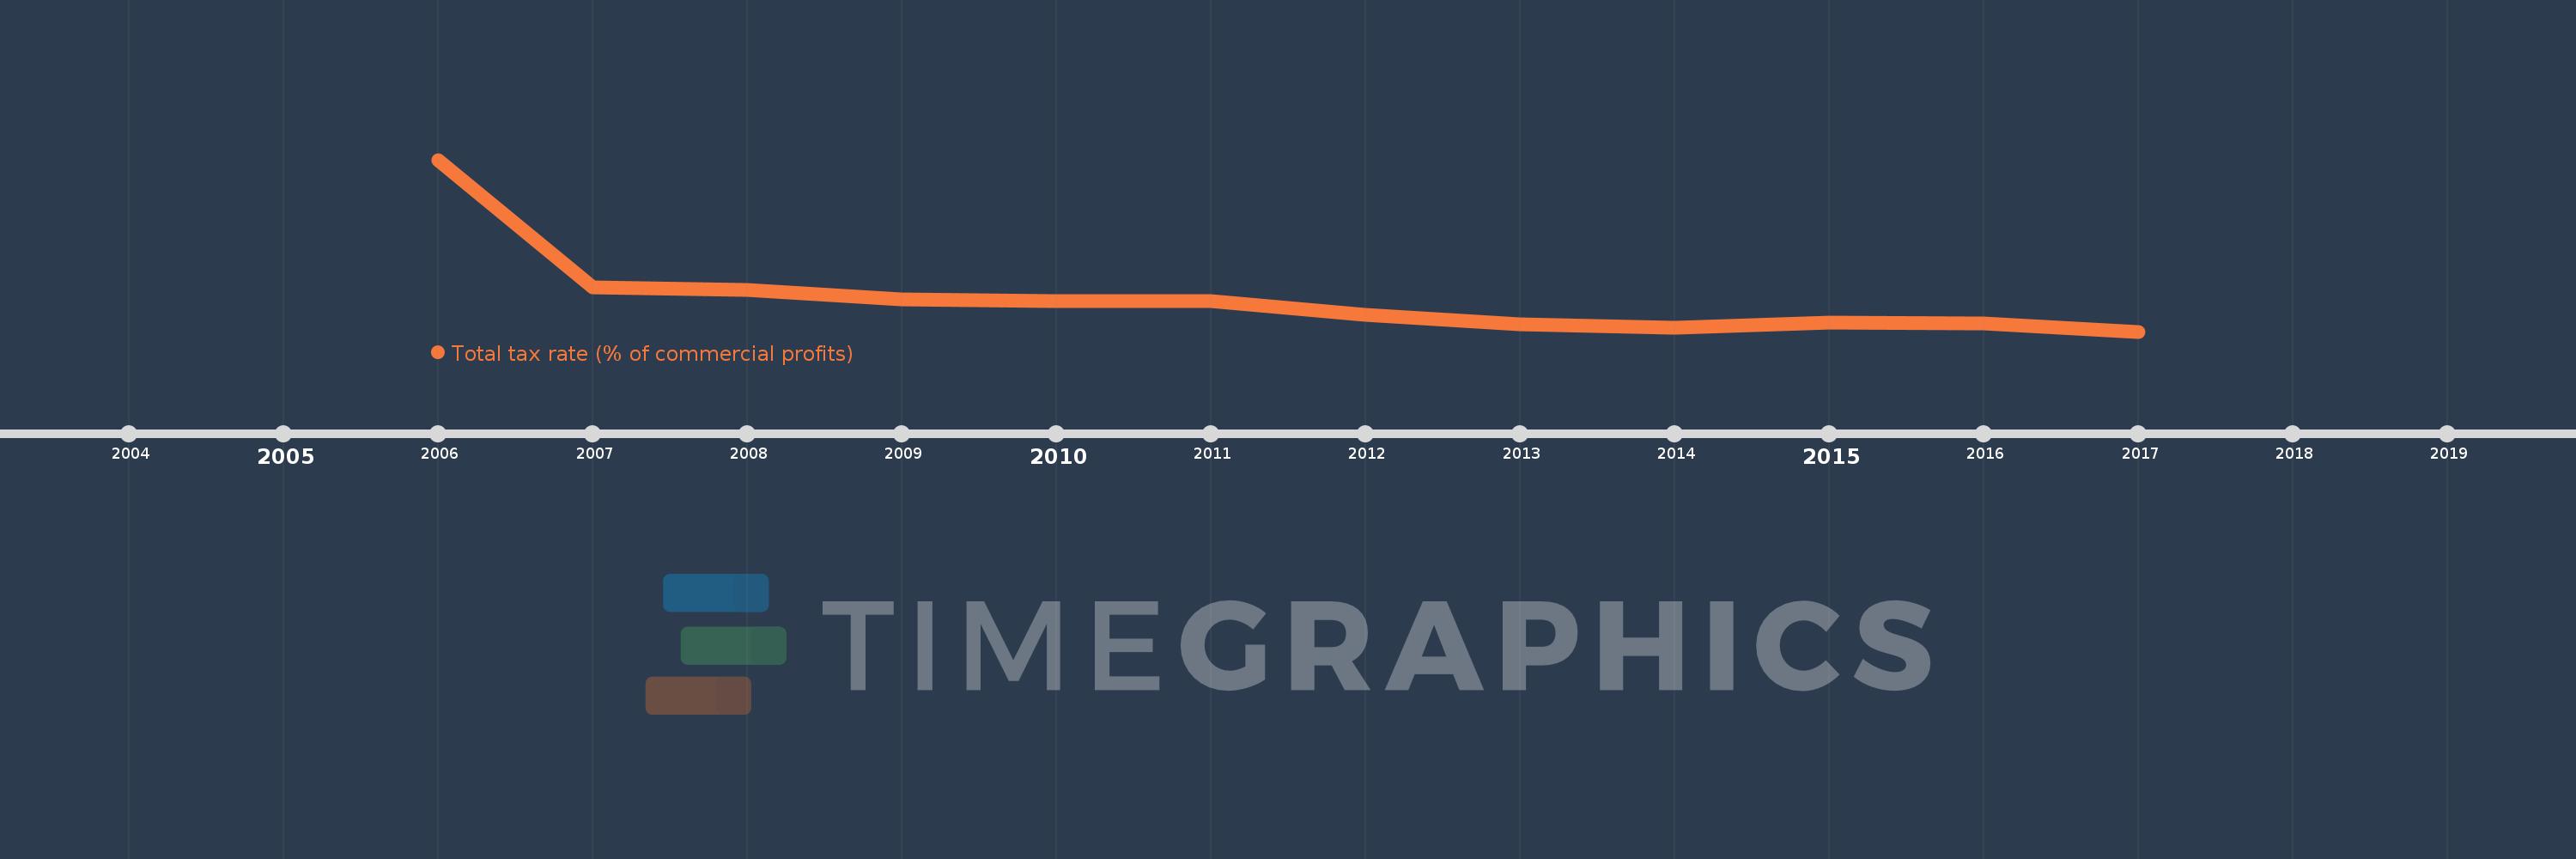
This timeline shows a graph from 2006 to 2017 of Middle East & North Africa (IDA & IBRD countries). No data until 2005. Number of actual observations by date: 12.
Source name:
World Development Indicators
Source organization:
World Bank, Doing Business project (http://www.doingbusiness.org/).
Categories, topics:
Private Sector, Public Sector
Last updated:
apr 23, 2017
Indicators value changes by year
Meaning:
44.754
Minimum:
41.2
jan 1, 2017
Maximum:
59.736
jan 1, 2006
At the date of observation
Value
Absolute change
Change from the previous value
jan 1, 2006
59.736
+59.736
0.0%
jan 1, 2007
45.945
-13.791
-23.09%
jan 1, 2008
45.691
-0.255
-0.55%
jan 1, 2009
44.7
-0.991
-2.17%
jan 1, 2010
44.445
-0.255
-0.57%
jan 1, 2011
44.509
+0.064
0.14%
jan 1, 2012
42.991
-1.518
-3.41%
jan 1, 2013
41.967
-1.024
-2.38%
jan 1, 2014
41.592
-0.375
-0.89%
jan 1, 2015
42.208
+0.617
1.48%
jan 1, 2016
42.058
-0.15
-0.36%
jan 1, 2017
41.2
-0.858
-2.04%
Ranking of countries by current statistics by years