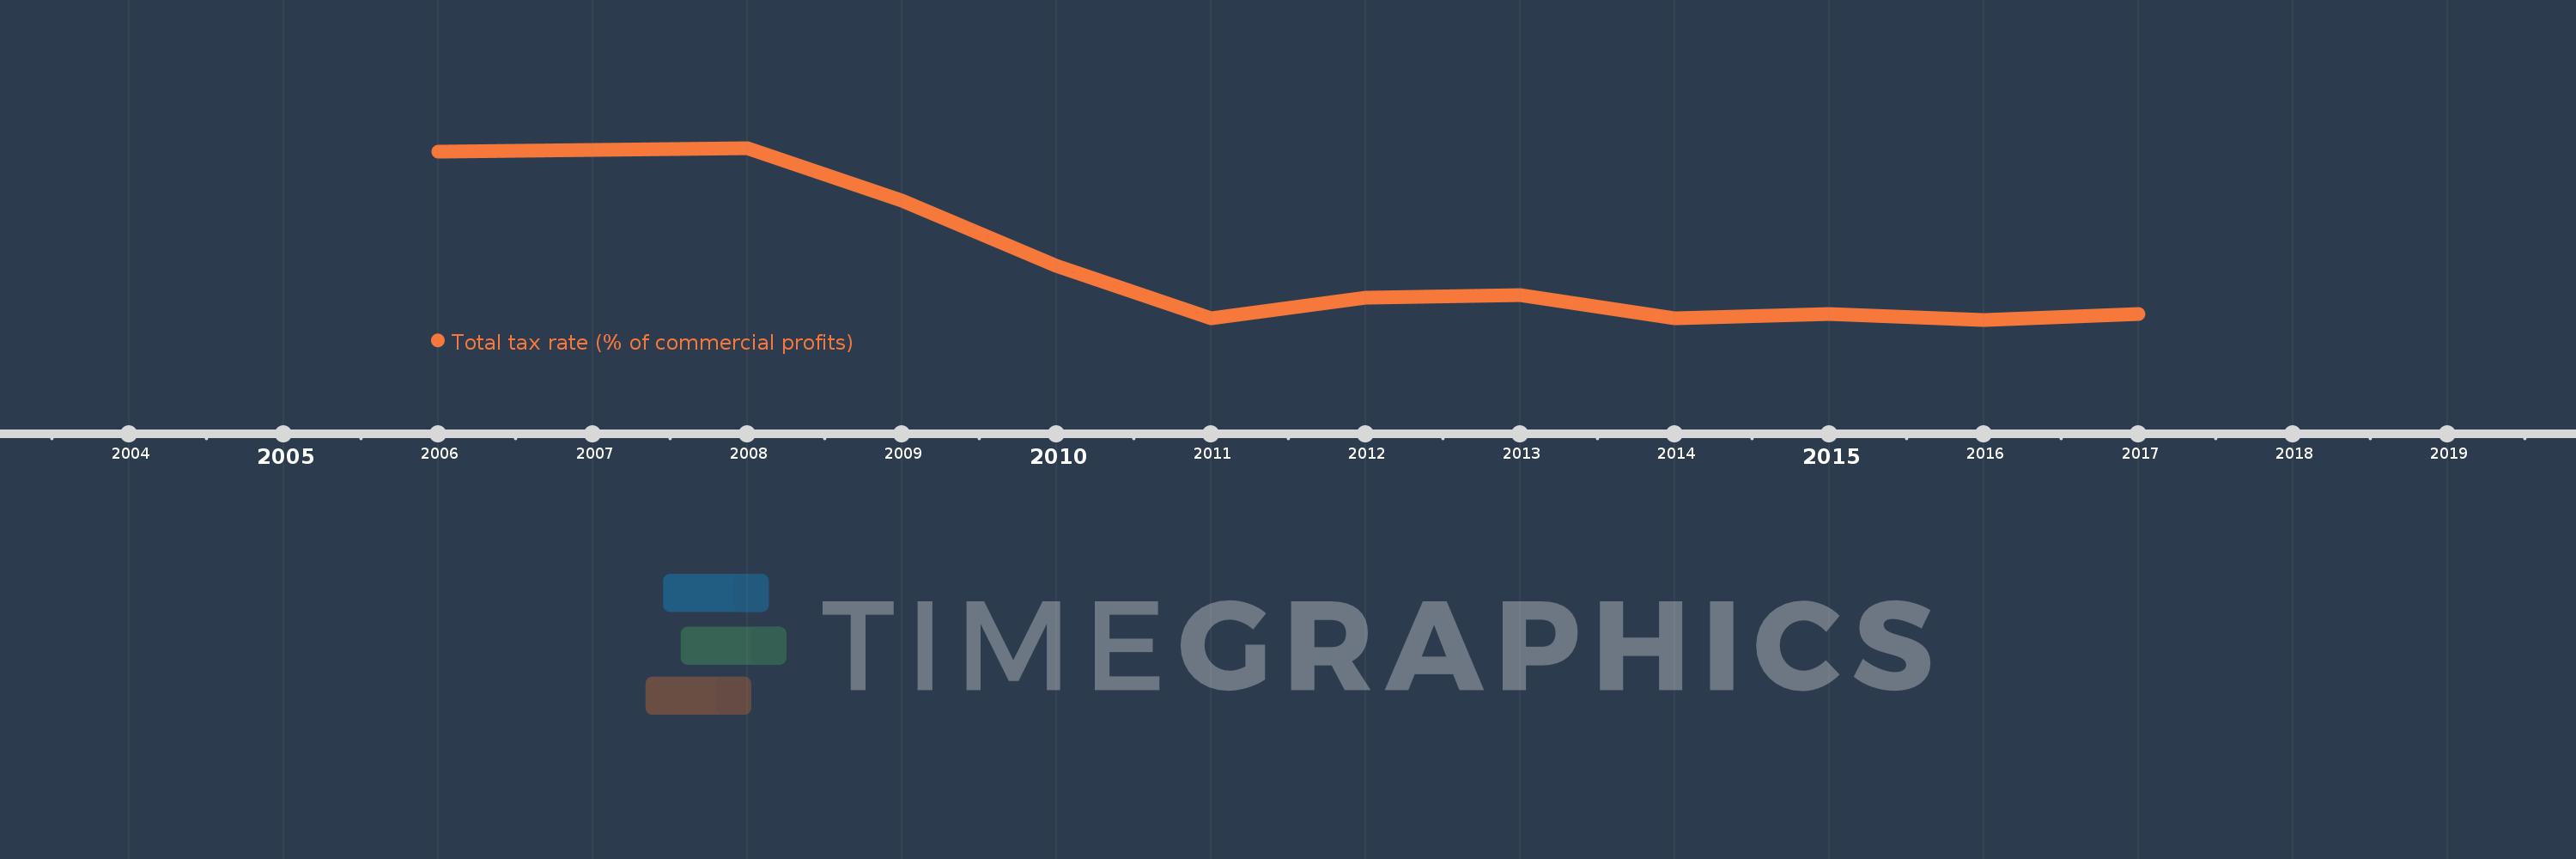
This timeline shows a graph from 2006 to 2017 of East Asia & Pacific (IDA & IBRD countries). No data until 2005. Number of actual observations by date: 12.
Source name:
World Development Indicators
Source organization:
World Bank, Doing Business project (http://www.doingbusiness.org/).
Categories, topics:
Private Sector, Public Sector
Last updated:
apr 23, 2017
Indicators value changes by year
Meaning:
37.883
Minimum:
36.167
jan 1, 2016
Maximum:
40.925
jan 1, 2008
At the date of observation
Value
Absolute change
Change from the previous value
jan 1, 2006
40.815
+40.815
0.0%
jan 1, 2007
40.88
+0.065
0.16%
jan 1, 2008
40.925
+0.045
0.11%
jan 1, 2009
39.46
-1.465
-3.58%
jan 1, 2010
37.655
-1.805
-4.57%
jan 1, 2011
36.2
-1.455
-3.86%
jan 1, 2012
36.79
+0.59
1.63%
jan 1, 2013
36.843
+0.053
0.14%
jan 1, 2014
36.205
-0.638
-1.73%
jan 1, 2015
36.329
+0.124
0.34%
jan 1, 2016
36.167
-0.162
-0.45%
jan 1, 2017
36.324
+0.157
0.43%
Ranking of countries by current statistics by years