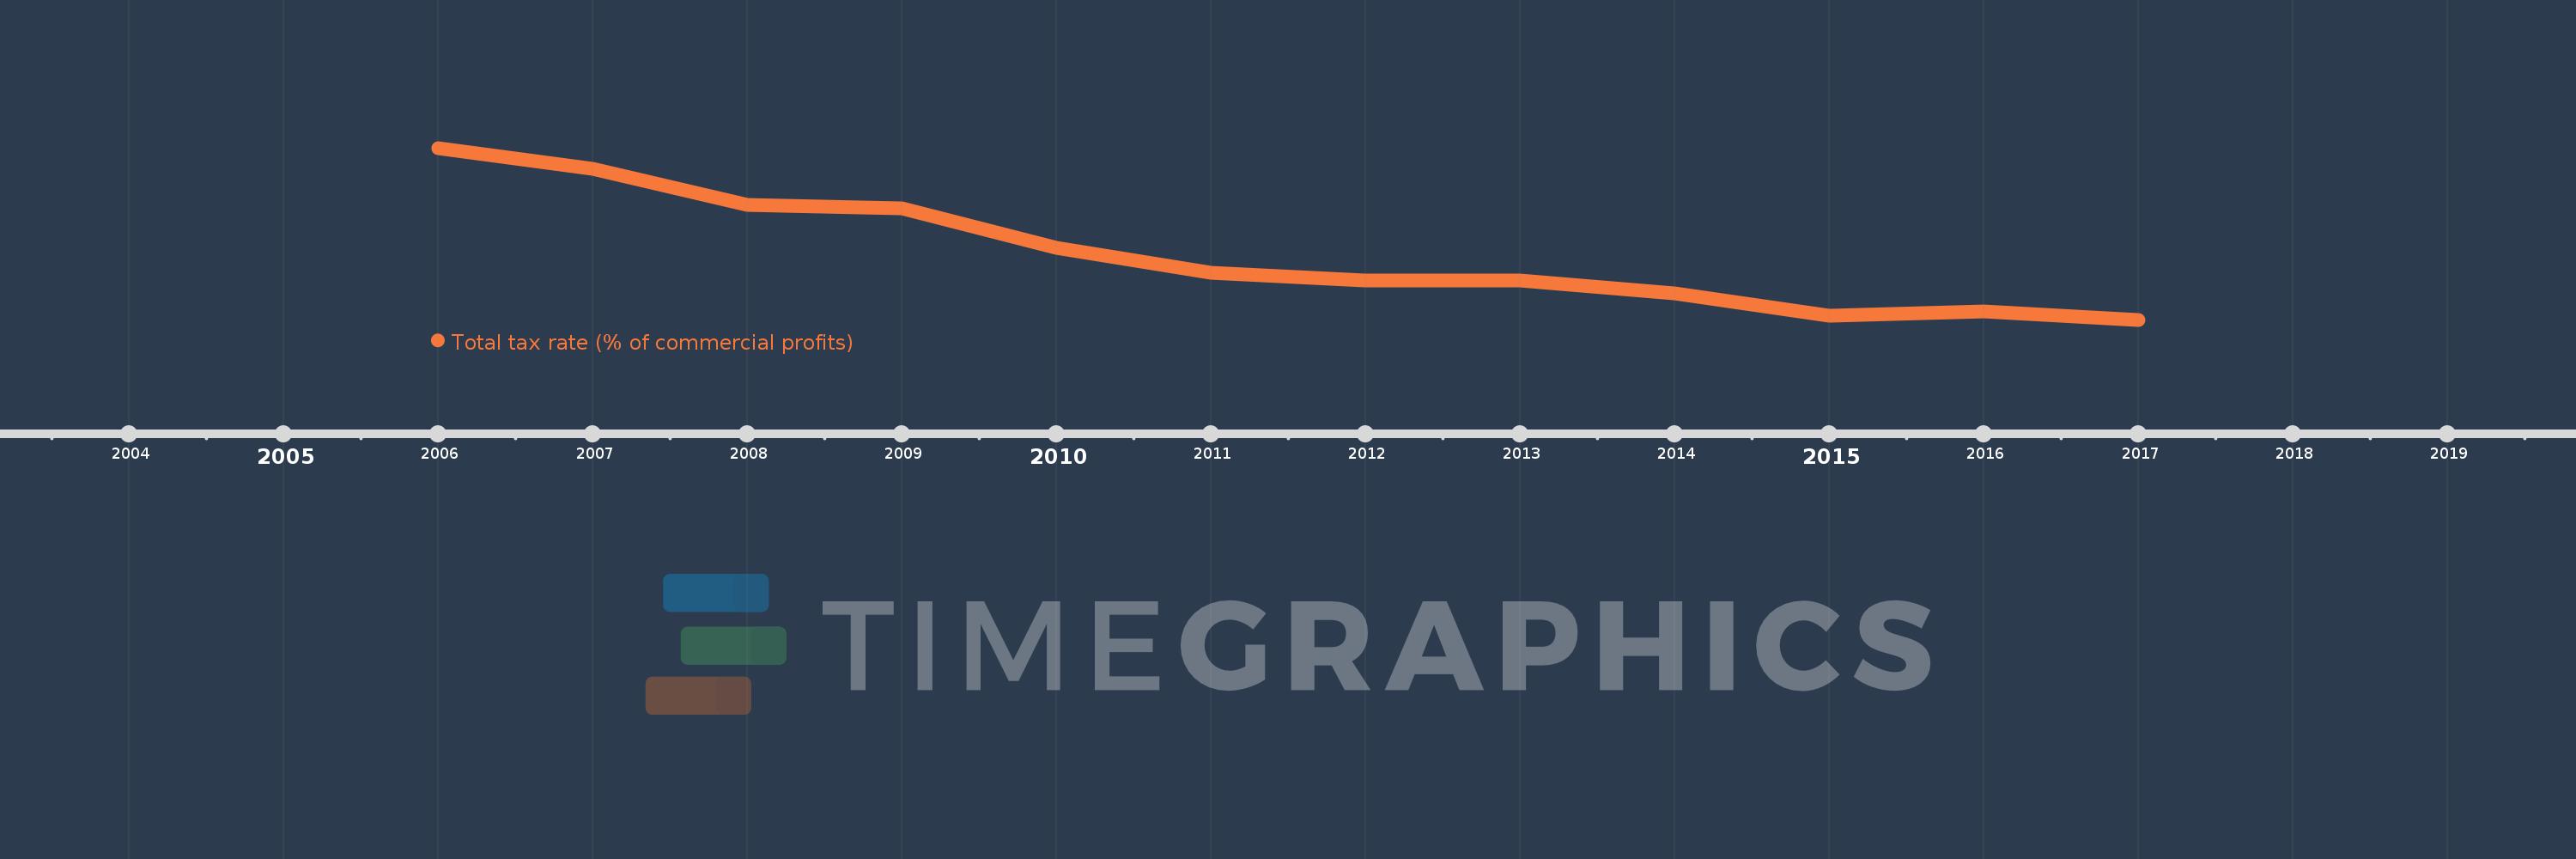
This timeline shows a graph from 2006 to 2017 of Europe & Central Asia (IDA & IBRD countries). No data until 2005. Number of actual observations by date: 12.
Source name:
World Development Indicators
Source organization:
World Bank, Doing Business project (http://www.doingbusiness.org/).
Categories, topics:
Private Sector, Public Sector
Last updated:
apr 23, 2017
Indicators value changes by year
Meaning:
42.022
Minimum:
33.986
jan 1, 2017
Maximum:
55.085
jan 1, 2006
At the date of observation
Value
Absolute change
Change from the previous value
jan 1, 2006
55.085
+55.085
0.0%
jan 1, 2007
52.49
-2.595
-4.71%
jan 1, 2008
48.1
-4.39
-8.36%
jan 1, 2009
47.667
-0.433
-0.9%
jan 1, 2010
42.768
-4.898
-10.28%
jan 1, 2011
39.791
-2.977
-6.96%
jan 1, 2012
38.777
-1.014
-2.55%
jan 1, 2013
38.791
+0.014
0.04%
jan 1, 2014
37.273
-1.518
-3.91%
jan 1, 2015
34.523
-2.75
-7.38%
jan 1, 2016
35.014
+0.491
1.42%
jan 1, 2017
33.986
-1.027
-2.93%
Ranking of countries by current statistics by years