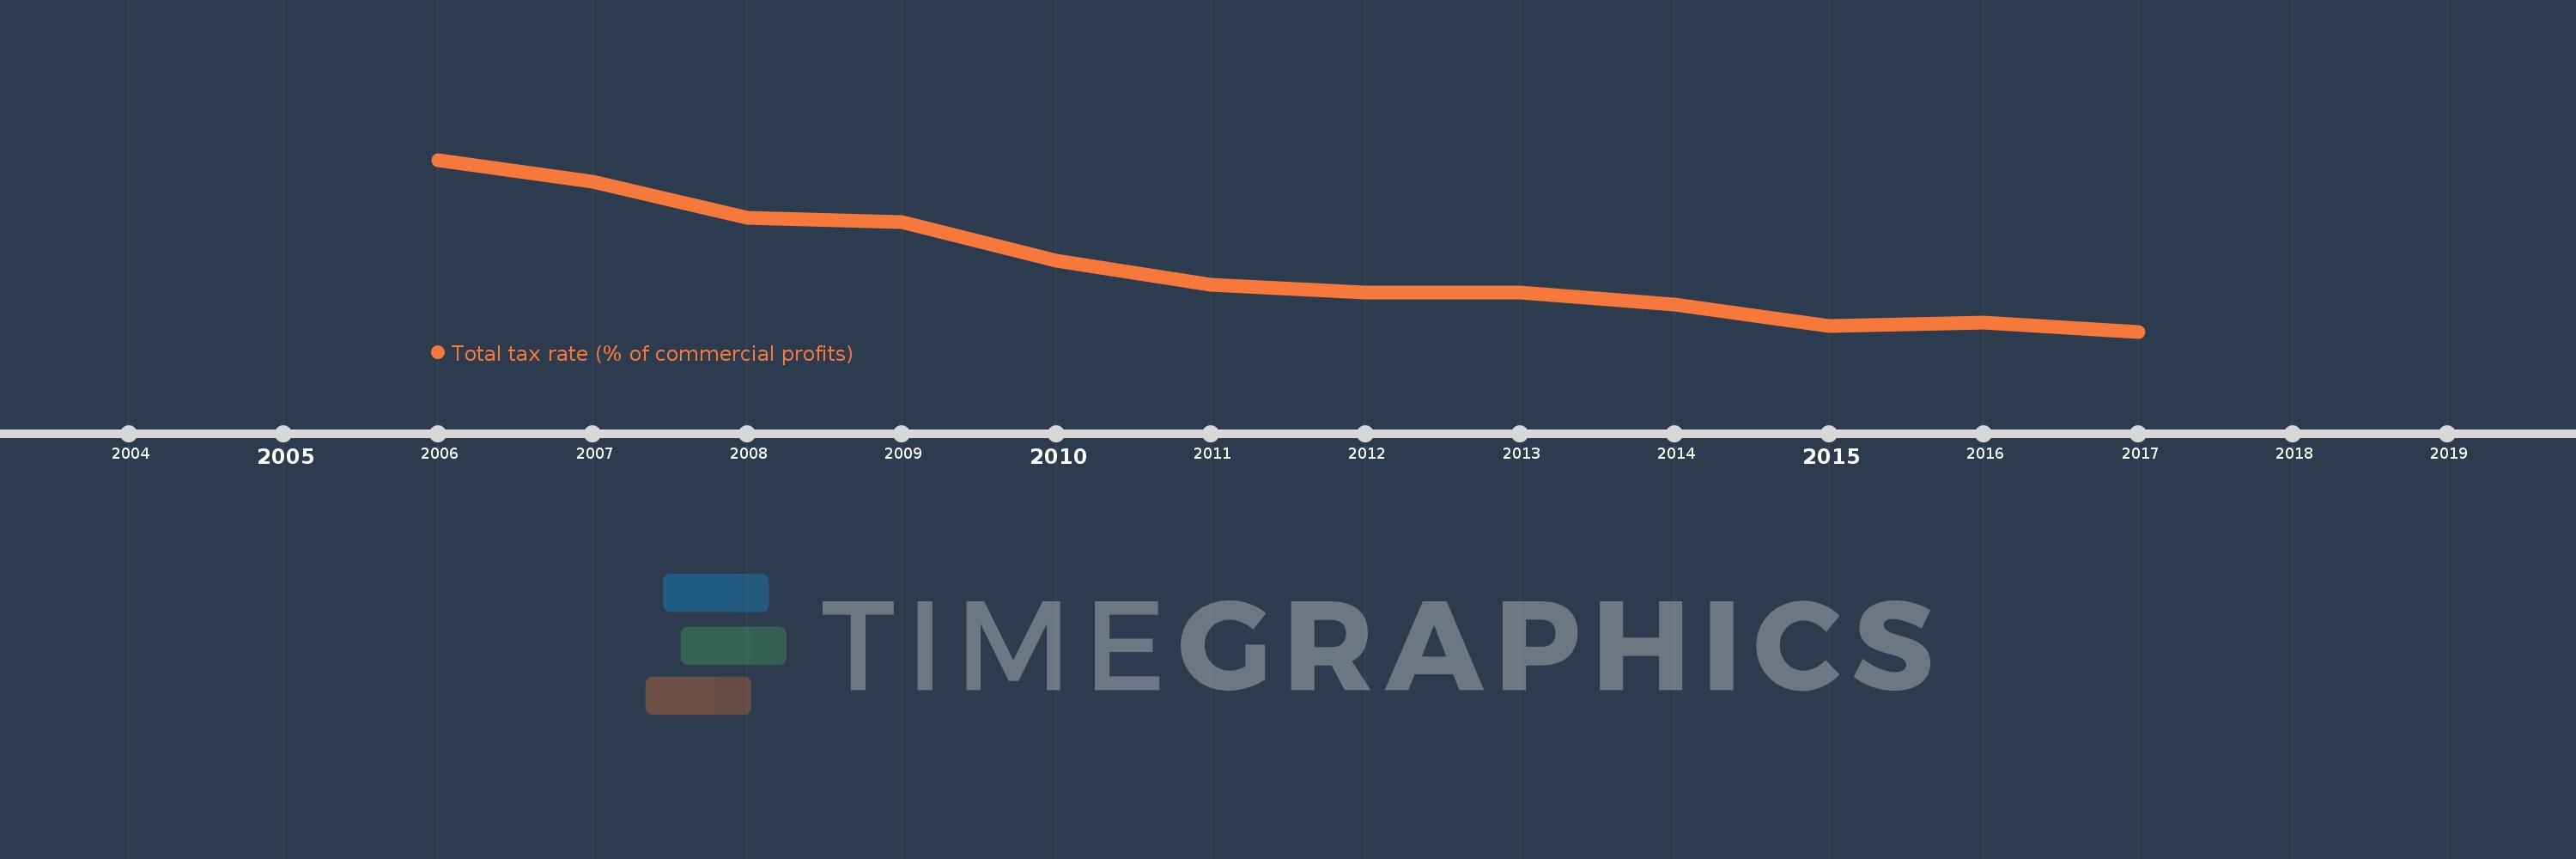
This timeline shows a graph from 2006 to 2017 of Europe & Central Asia (excluding high income). No data until 2005. Number of actual observations by date: 12.
Source name:
World Development Indicators
Source organization:
World Bank, Doing Business project (http://www.doingbusiness.org/).
Categories, topics:
Private Sector, Public Sector
Last updated:
apr 23, 2017
Indicators value changes by year
Meaning:
43.161
Minimum:
34.32
jan 1, 2017
Maximum:
57.65
jan 1, 2006
At the date of observation
Value
Absolute change
Change from the previous value
jan 1, 2006
57.65
+57.65
0.0%
jan 1, 2007
54.647
-3.003
-5.21%
jan 1, 2008
49.784
-4.863
-8.9%
jan 1, 2009
49.216
-0.568
-1.14%
jan 1, 2010
43.895
-5.321
-10.81%
jan 1, 2011
40.665
-3.23
-7.36%
jan 1, 2012
39.585
-1.08
-2.66%
jan 1, 2013
39.595
+0.01
0.03%
jan 1, 2014
38.03
-1.565
-3.95%
jan 1, 2015
35.05
-2.98
-7.84%
jan 1, 2016
35.5
+0.45
1.28%
jan 1, 2017
34.32
-1.18
-3.32%
Ranking of countries by current statistics by years