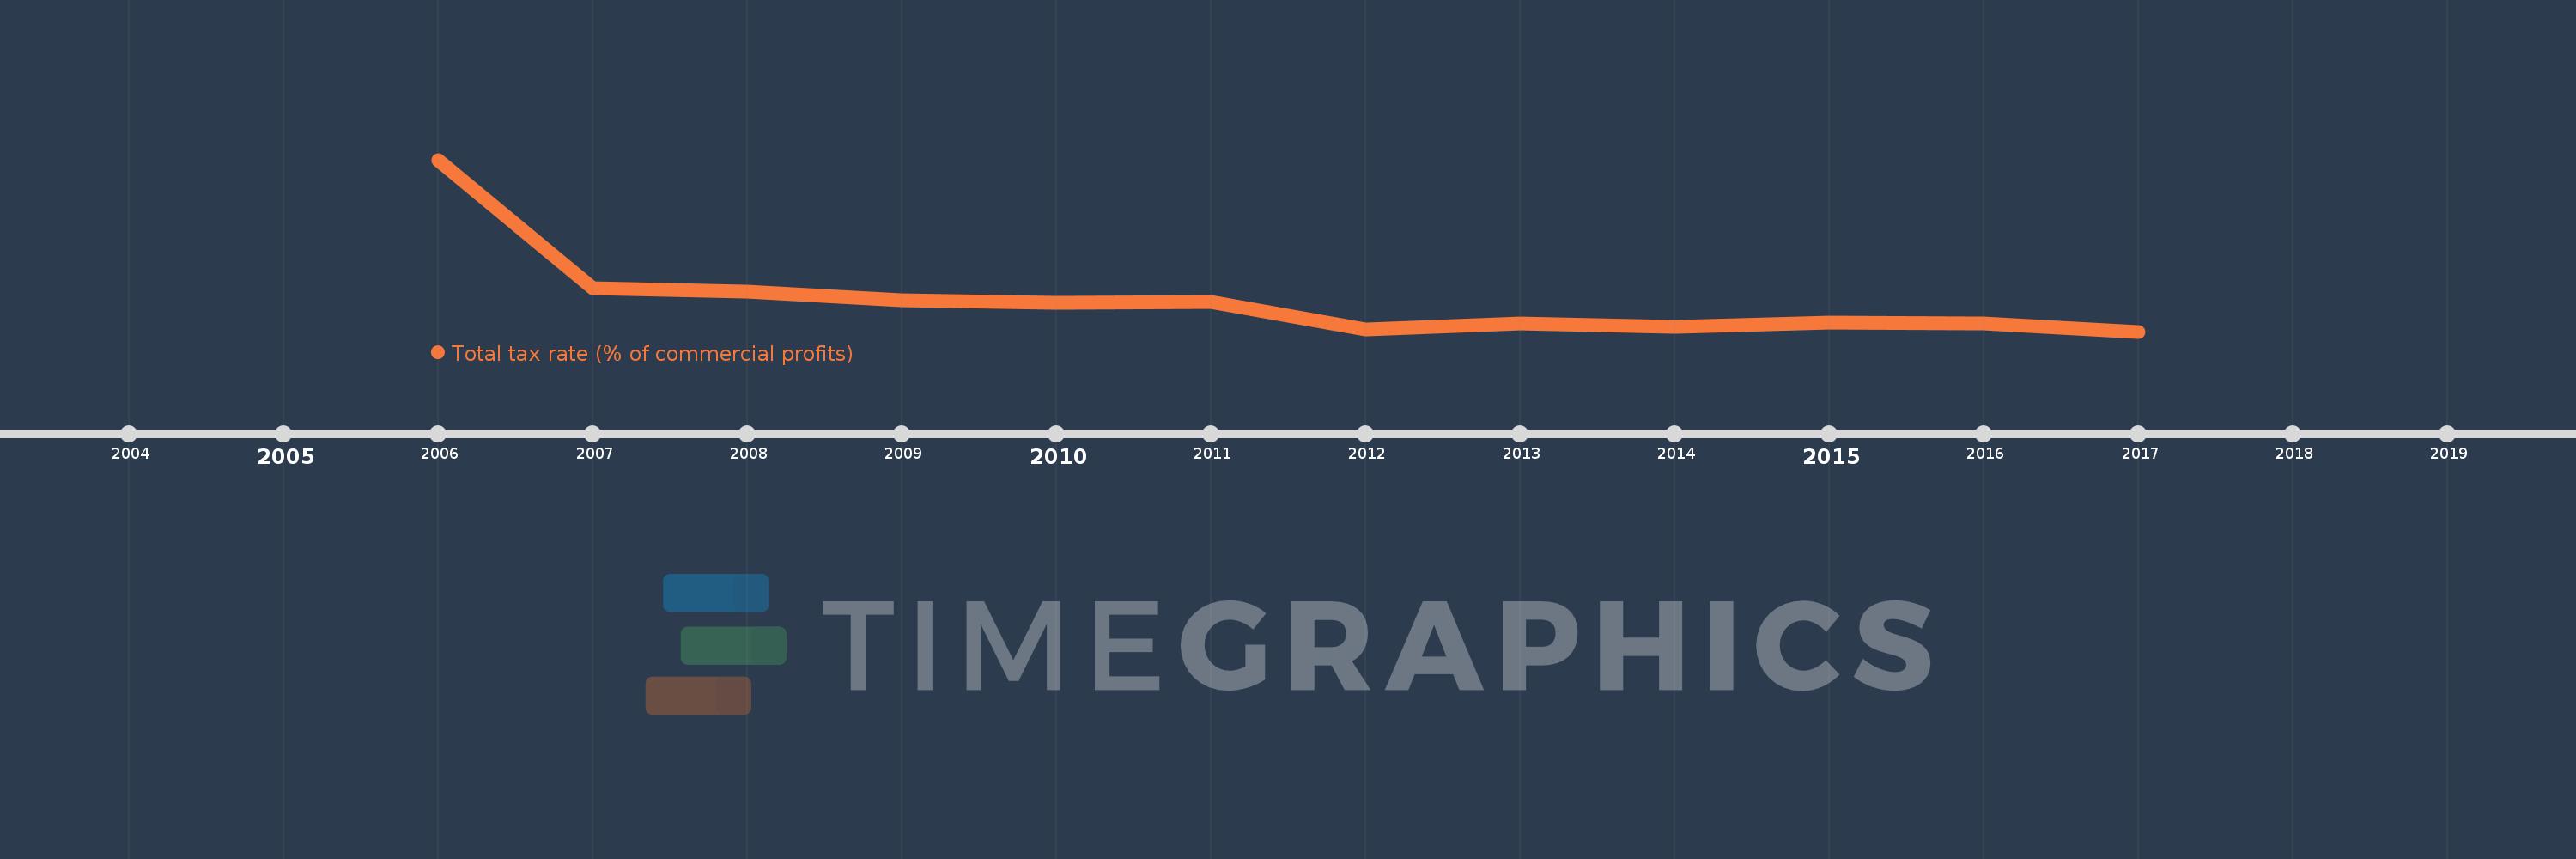
This timeline shows a graph from 2006 to 2017 of Middle East & North Africa (excluding high income). No data until 2005. Number of actual observations by date: 12.
Source name:
World Development Indicators
Source organization:
World Bank, Doing Business project (http://www.doingbusiness.org/).
Categories, topics:
Private Sector, Public Sector
Last updated:
apr 23, 2017
Indicators value changes by year
Meaning:
42.387
Minimum:
39.208
jan 1, 2017
Maximum:
56.633
jan 1, 2006
At the date of observation
Value
Absolute change
Change from the previous value
jan 1, 2006
56.633
+56.633
0.0%
jan 1, 2007
43.625
-13.008
-22.97%
jan 1, 2008
43.283
-0.342
-0.78%
jan 1, 2009
42.35
-0.933
-2.16%
jan 1, 2010
42.117
-0.233
-0.55%
jan 1, 2011
42.175
+0.058
0.14%
jan 1, 2012
39.442
-2.733
-6.48%
jan 1, 2013
40.008
+0.566
1.44%
jan 1, 2014
39.662
-0.346
-0.87%
jan 1, 2015
40.138
+0.477
1.2%
jan 1, 2016
40.0
-0.138
-0.34%
jan 1, 2017
39.208
-0.792
-1.98%
Ranking of countries by current statistics by years