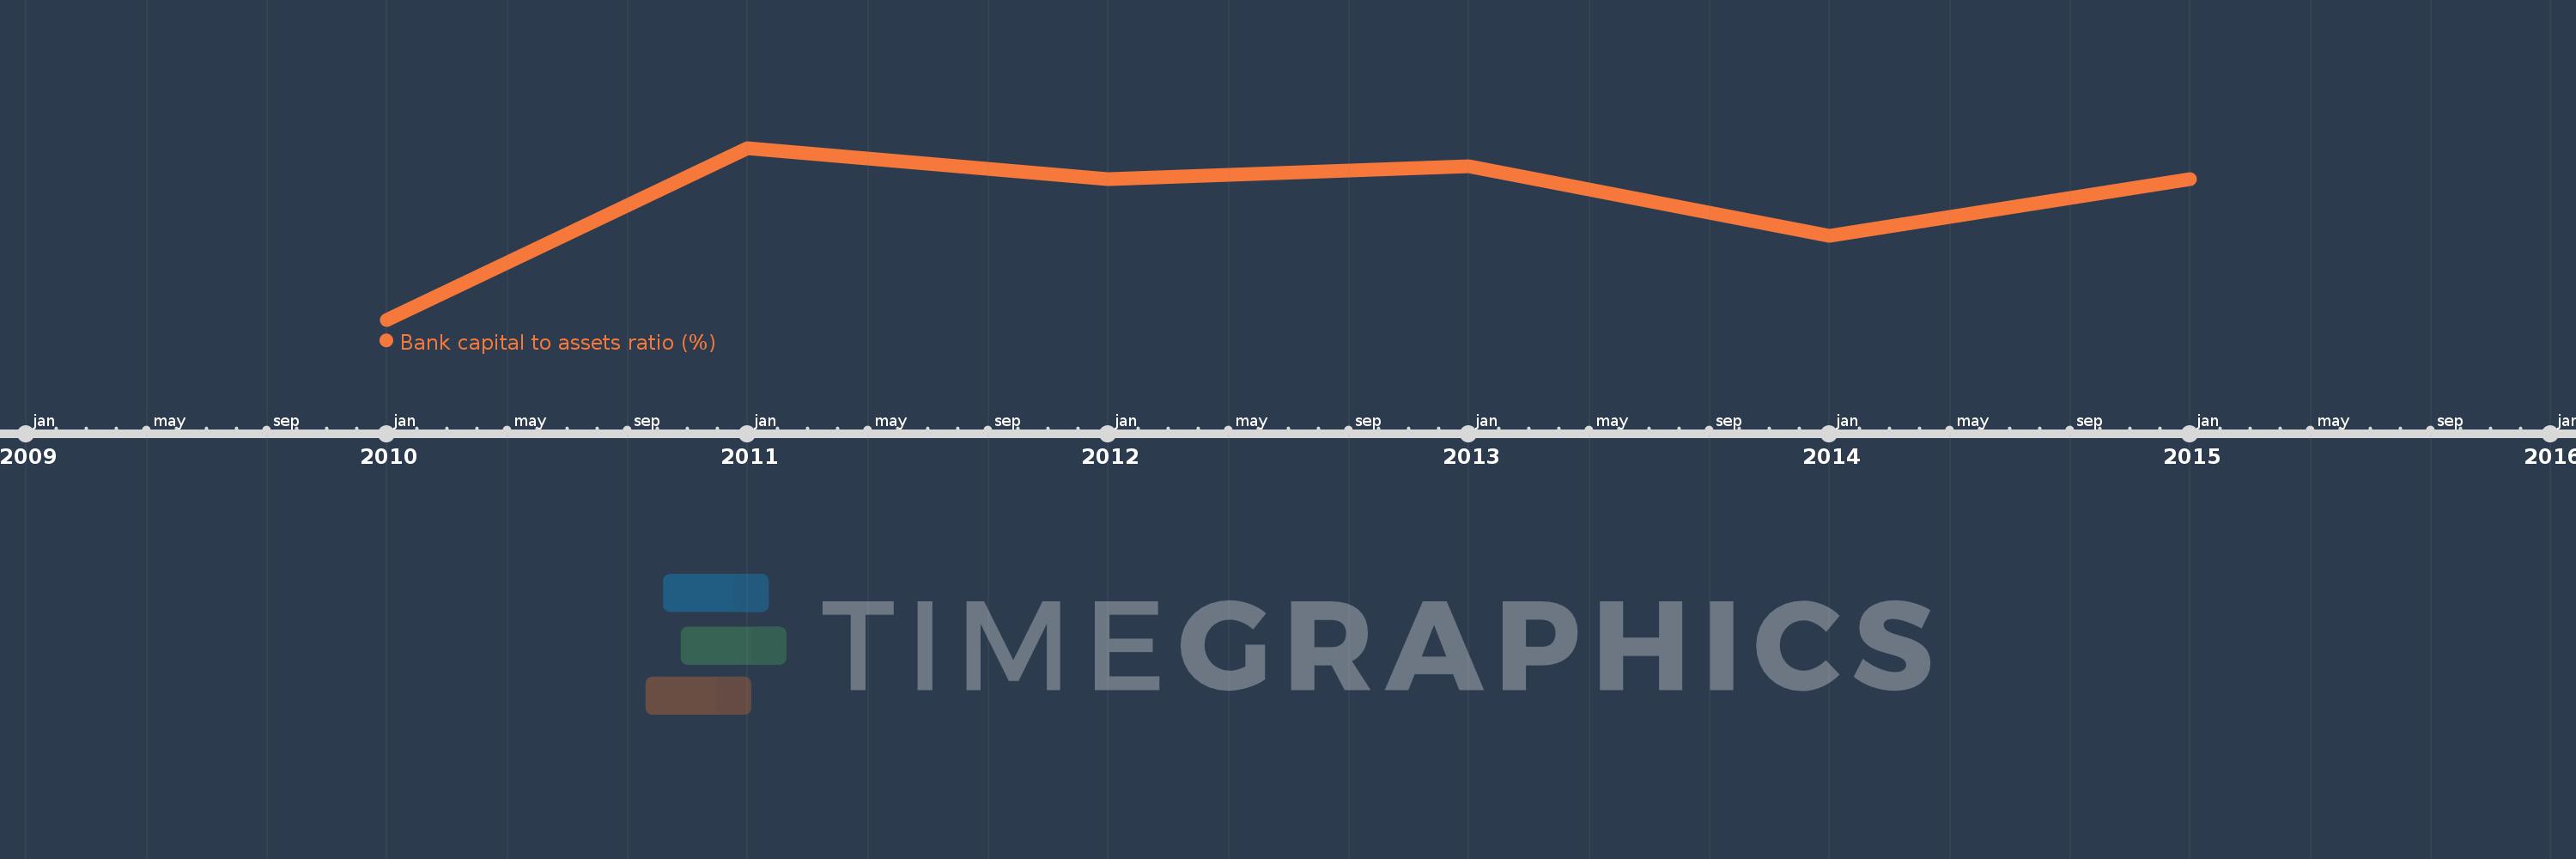
This timeline shows a graph from 2010 to 2015 of Middle East & North Africa (IDA & IBRD countries). No data until 2009. Number of actual observations by date: 6.
Source name:
World Development Indicators
Source organization:
International Monetary Fund, Global Financial Stability Report.
Categories, topics:
Financial Sector
Last updated:
apr 23, 2017
Indicators value changes by year
Meaning:
7.938
Minimum:
7.2
jan 1, 2010
Maximum:
8.3
jan 1, 2011
At the date of observation
Value
Absolute change
Change from the previous value
jan 1, 2010
7.2
+7.2
0.0%
jan 1, 2011
8.3
+1.1
15.28%
jan 1, 2012
8.1
-0.2
-2.41%
jan 1, 2013
8.184
+0.084
1.04%
jan 1, 2014
7.739
-0.446
-5.44%
jan 1, 2015
8.102
+0.363
4.7%
Ranking of countries by current statistics by years