Download This statistics in other country:
Timeline:
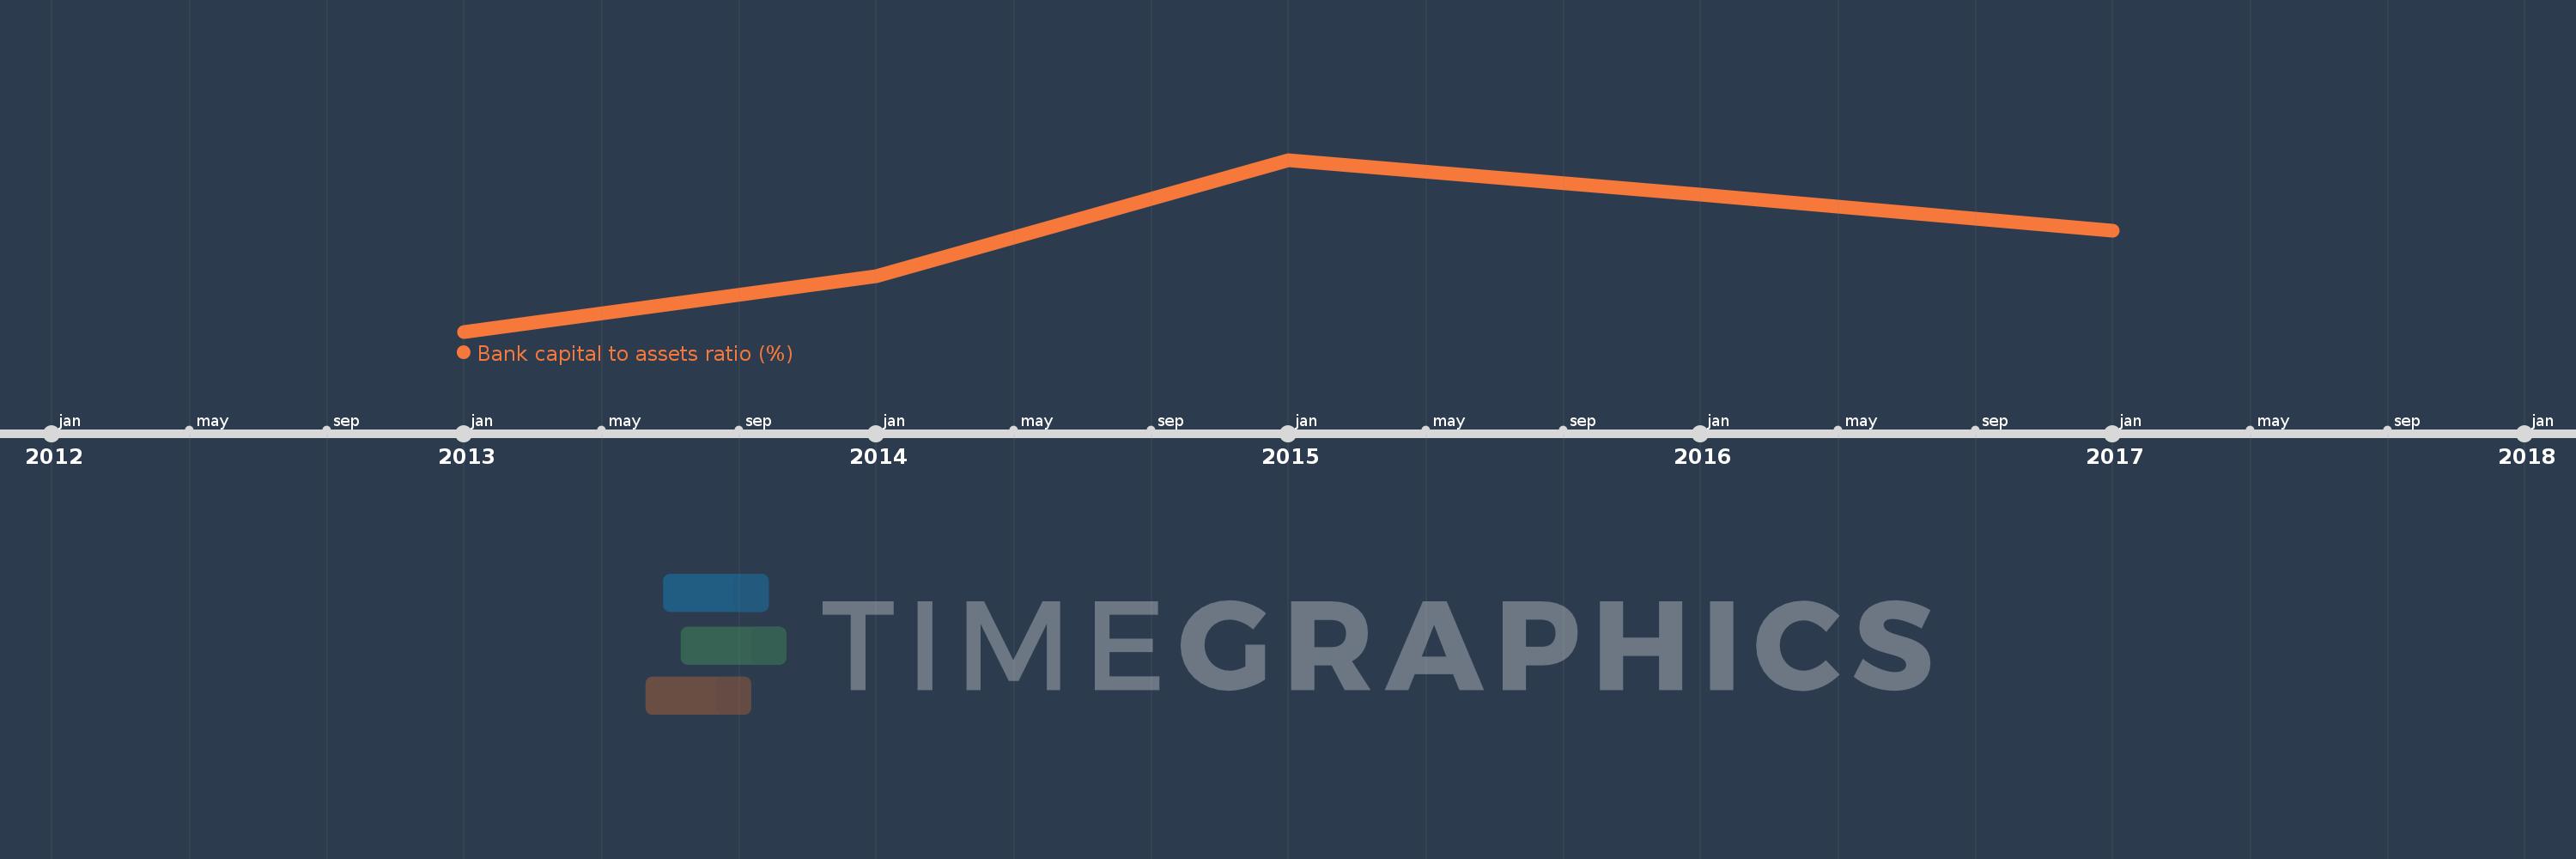
This timeline shows a graph from 2013 to 2017 of Tonga. No data until 2012. Number of actual observations by date: 5.
Source name:
World Development Indicators
Source organization:
International Monetary Fund, Global Financial Stability Report.
Categories, topics:
Financial Sector
Last updated:
apr 23, 2017
Indicators value changes by year
Minimum:
16.556
jan 1, 2013
Maximum:
20.356
jan 1, 2015
At the date of observation
Value
Absolute change
Change from the previous value
jan 1, 2013
16.556
+16.556
0.0%
jan 1, 2014
17.781
+1.225
7.4%
jan 1, 2015
20.356
+2.575
14.48%
jan 1, 2016
19.587
-0.77
-3.78%
jan 1, 2017
18.793
-0.793
-4.05%
Ranking of countries by current statistics by years