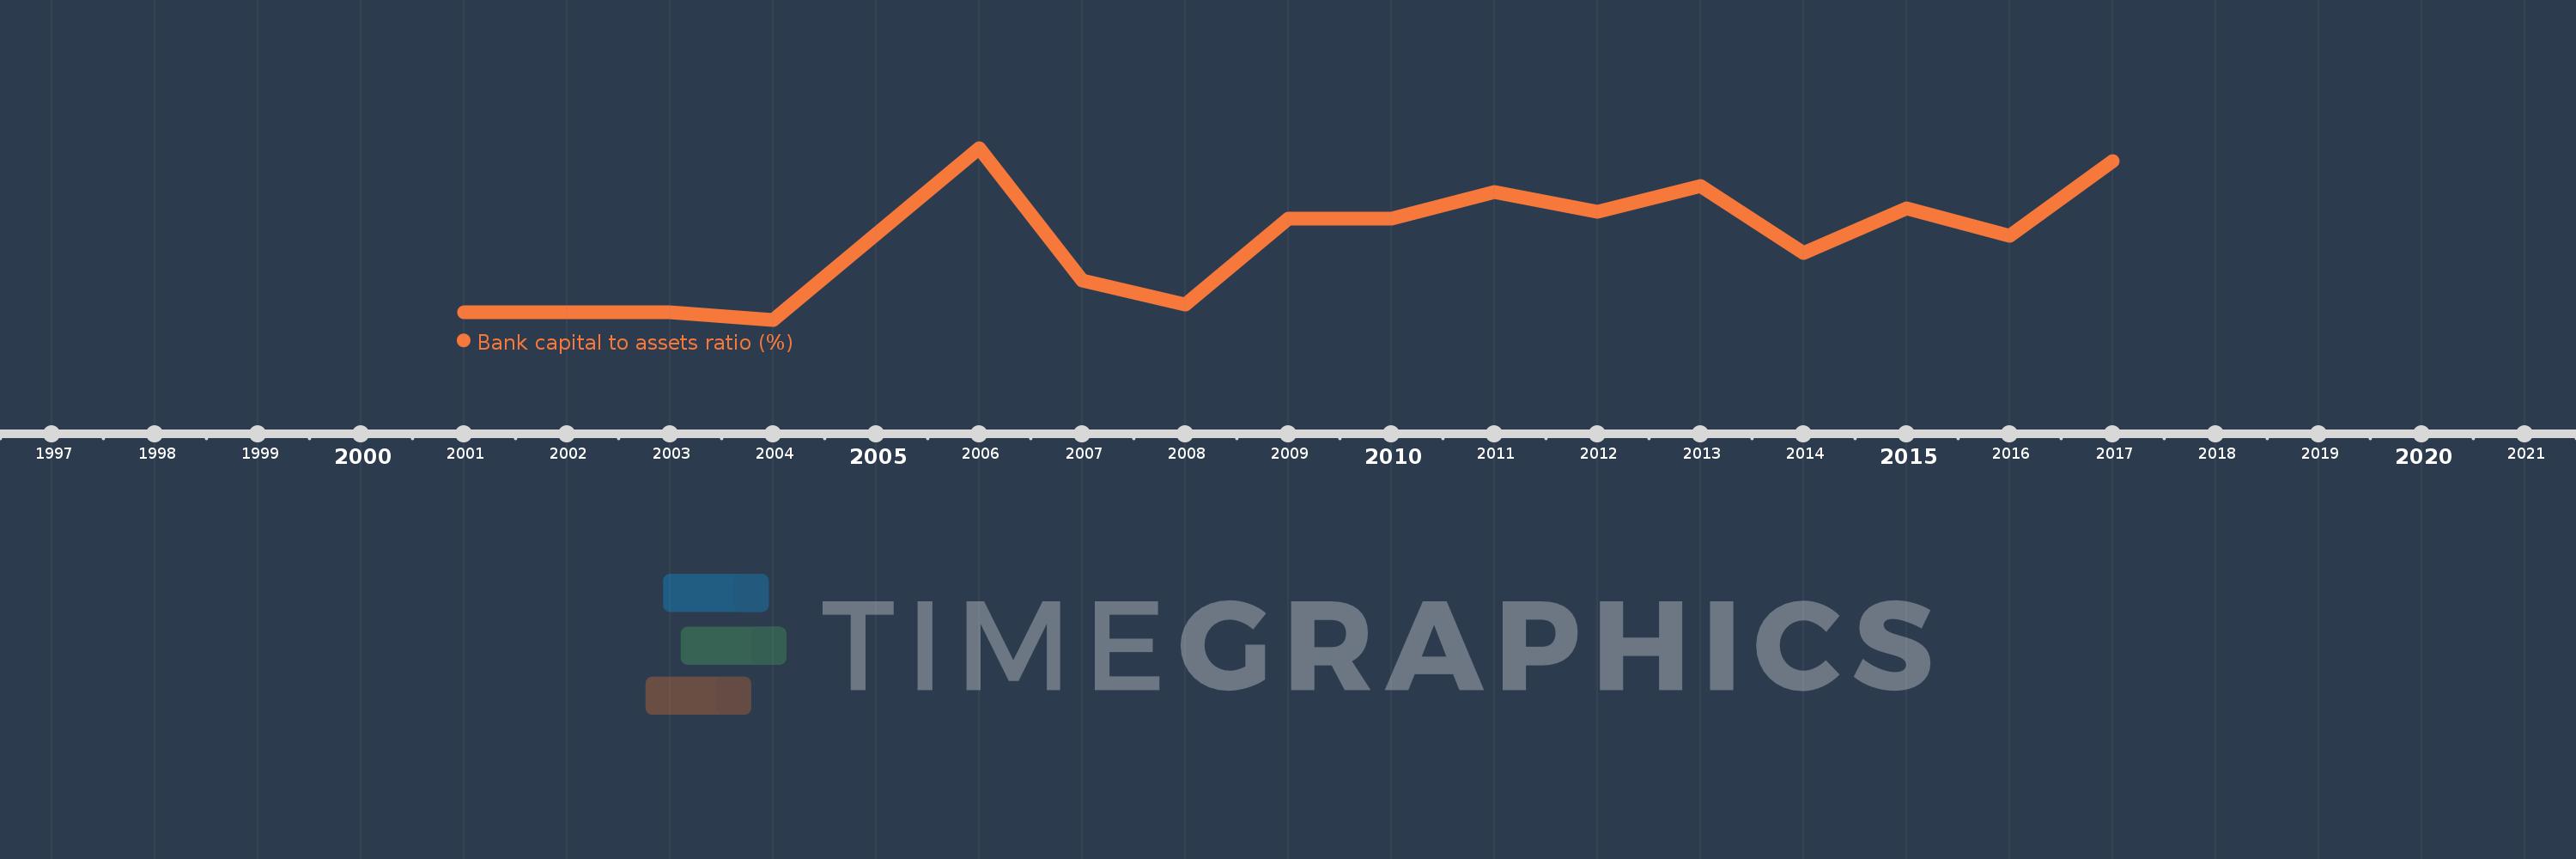
This timeline shows a graph from 2001 to 2017 of Latin America & the Caribbean (IDA & IBRD countries). No data until 2000. Number of actual observations by date: 16.
Source name:
World Development Indicators
Source organization:
International Monetary Fund, Global Financial Stability Report.
Categories, topics:
Financial Sector
Last updated:
apr 23, 2017
Indicators value changes by year
Meaning:
10.047
Minimum:
9.55
jan 1, 2004
Maximum:
10.65
jan 1, 2006
At the date of observation
Value
Absolute change
Change from the previous value
jan 1, 2001
9.6
+9.6
0.0%
jan 1, 2002
9.6
0.0
0.0%
jan 1, 2003
9.6
0.0
0.0%
jan 1, 2004
9.55
-0.05
-0.52%
jan 1, 2006
10.65
+1.1
11.52%
jan 1, 2007
9.8
-0.85
-7.98%
jan 1, 2008
9.65
-0.15
-1.53%
jan 1, 2009
10.2
+0.55
5.7%
jan 1, 2010
10.2
0.0
0.0%
jan 1, 2011
10.368
+0.168
1.65%
jan 1, 2012
10.241
-0.127
-1.23%
jan 1, 2013
10.408
+0.167
1.63%
jan 1, 2014
9.976
-0.432
-4.15%
jan 1, 2015
10.264
+0.288
2.89%
jan 1, 2016
10.087
-0.177
-1.72%
jan 1, 2017
10.565
+0.478
4.74%
Ranking of countries by current statistics by years