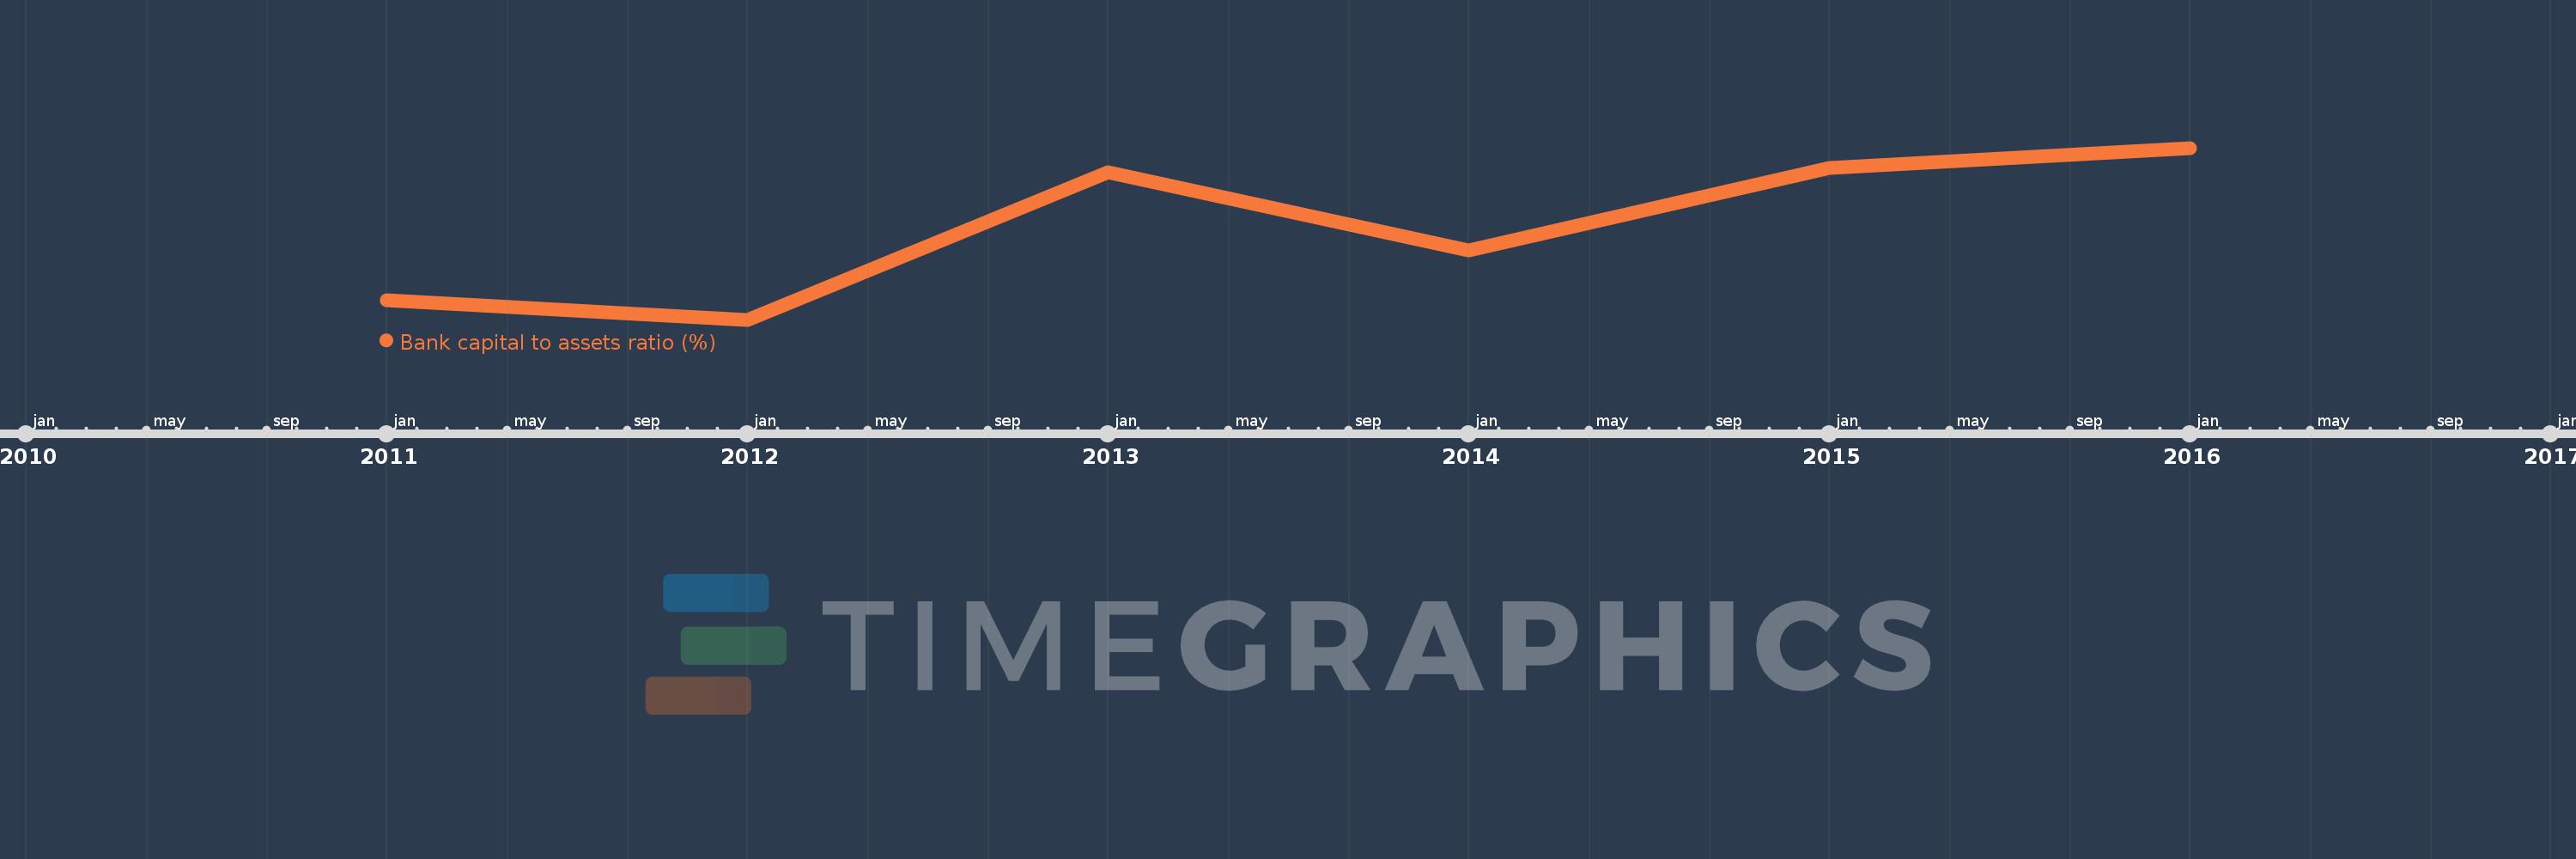
This timeline shows a graph from 2011 to 2016 of East Asia & Pacific (excluding high income). No data until 2010. Number of actual observations by date: 6.
Source name:
World Development Indicators
Source organization:
International Monetary Fund, Global Financial Stability Report.
Categories, topics:
Financial Sector
Last updated:
apr 23, 2017
Indicators value changes by year
Meaning:
9.698
Minimum:
9.299
jan 1, 2012
Maximum:
10.034
jan 1, 2016
At the date of observation
Value
Absolute change
Change from the previous value
jan 1, 2011
9.384
+9.384
0.0%
jan 1, 2012
9.299
-0.085
-0.91%
jan 1, 2013
9.931
+0.632
6.79%
jan 1, 2014
9.594
-0.337
-3.39%
jan 1, 2015
9.948
+0.354
3.69%
jan 1, 2016
10.034
+0.086
0.86%
Ranking of countries by current statistics by years