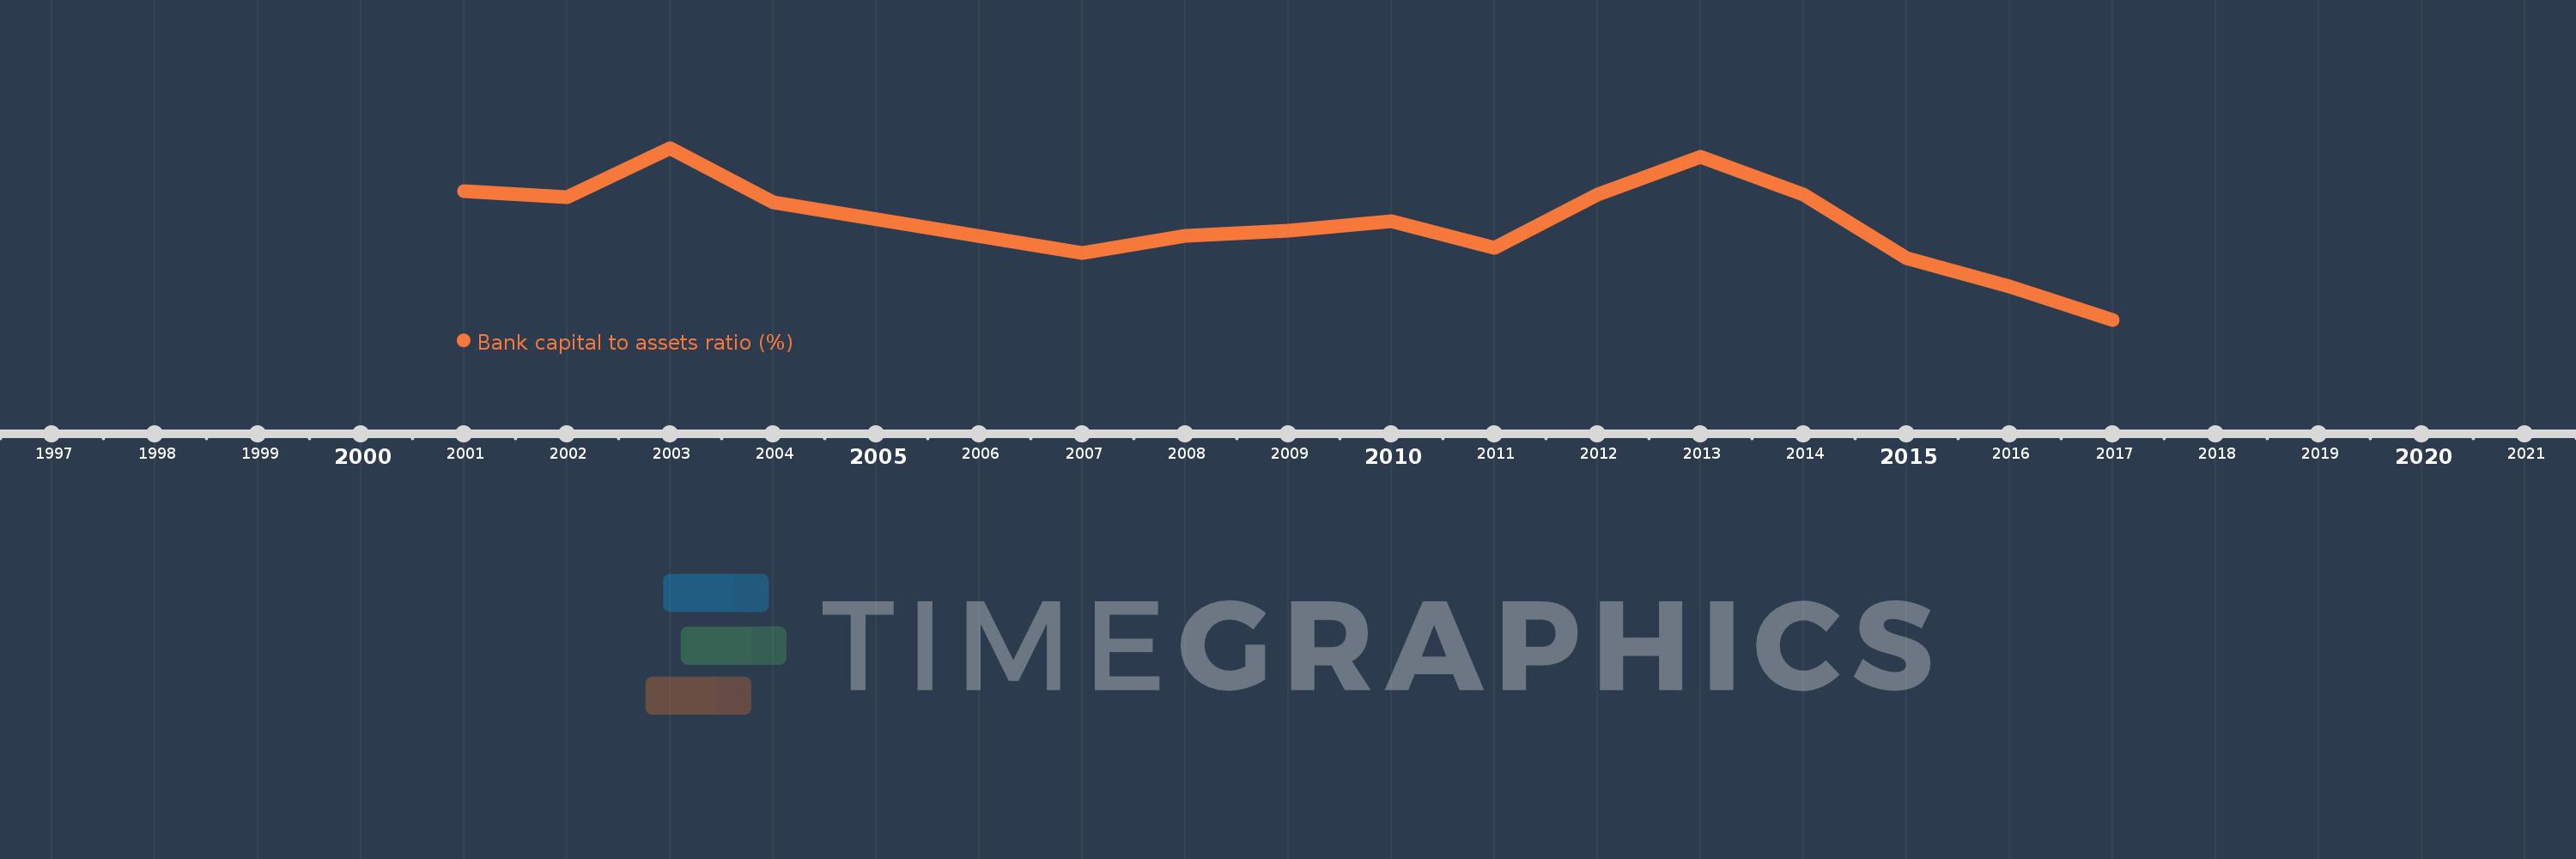
This timeline shows a graph from 2001 to 2017 of Europe & Central Asia (IDA & IBRD countries). No data until 2000. Number of actual observations by date: 15.
Source name:
World Development Indicators
Source organization:
International Monetary Fund, Global Financial Stability Report.
Categories, topics:
Financial Sector
Last updated:
apr 23, 2017
Indicators value changes by year
Meaning:
13.043
Minimum:
11.303
jan 1, 2017
Maximum:
14.373
jan 1, 2003
At the date of observation
Value
Absolute change
Change from the previous value
jan 1, 2001
13.6
+13.6
0.0%
jan 1, 2002
13.5
-0.1
-0.74%
jan 1, 2003
14.373
+0.873
6.47%
jan 1, 2004
13.4
-0.973
-6.77%
jan 1, 2007
12.5
-0.9
-6.72%
jan 1, 2008
12.8
+0.3
2.4%
jan 1, 2009
12.9
+0.1
0.78%
jan 1, 2010
13.069
+0.169
1.31%
jan 1, 2011
12.588
-0.481
-3.68%
jan 1, 2012
13.546
+0.958
7.61%
jan 1, 2013
14.219
+0.673
4.97%
jan 1, 2014
13.543
-0.676
-4.75%
jan 1, 2015
12.411
-1.132
-8.36%
jan 1, 2016
11.891
-0.52
-4.19%
jan 1, 2017
11.303
-0.588
-4.94%
Ranking of countries by current statistics by years