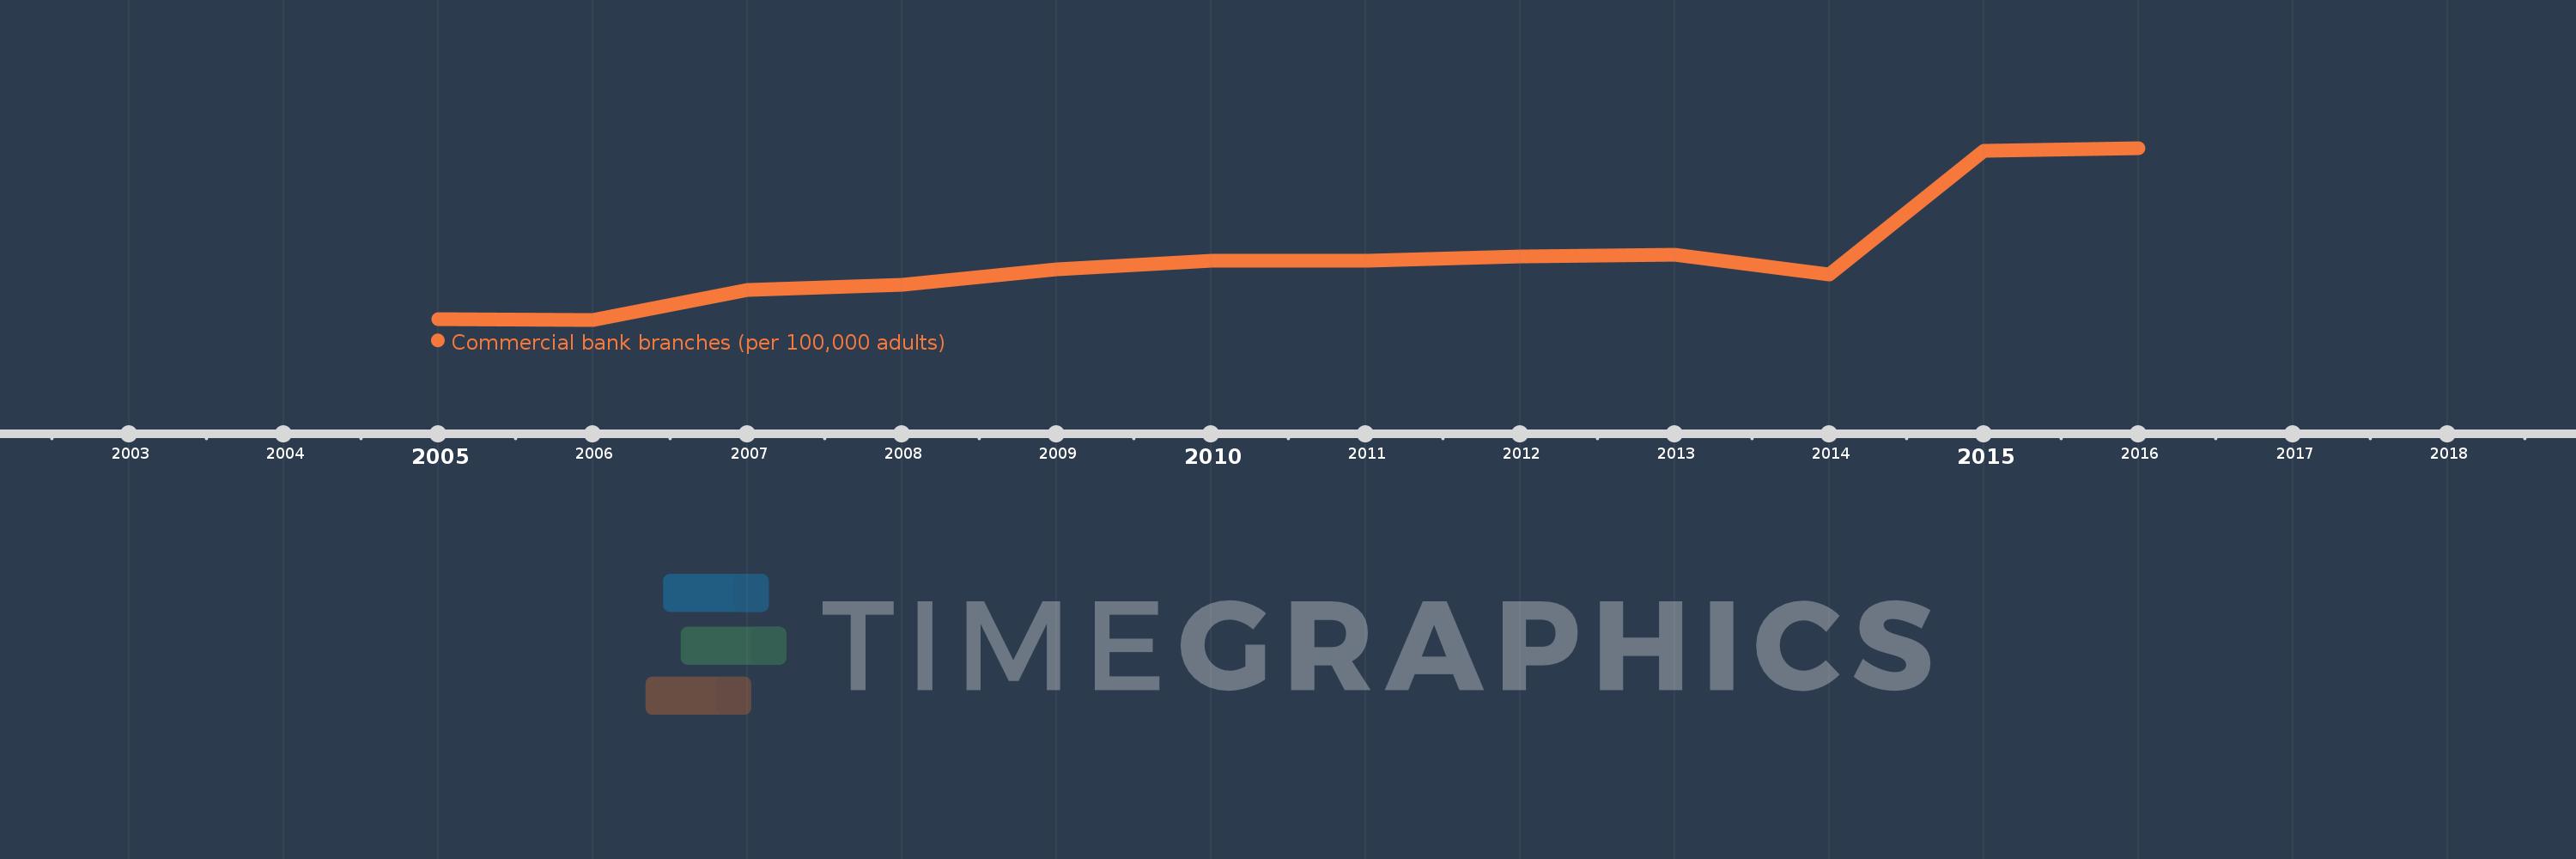
This timeline shows a graph from 2005 to 2016 of Middle East & North Africa (excluding high income). No data until 2004. Number of actual observations by date: 12.
Source name:
World Development Indicators
Source organization:
International Monetary Fund, Financial Access Survey.
Categories, topics:
Financial Sector
Last updated:
apr 23, 2017
Indicators value changes by year
Meaning:
10.89
Minimum:
8.77
jan 1, 2006
Maximum:
14.614
jan 1, 2016
At the date of observation
Value
Absolute change
Change from the previous value
jan 1, 2005
8.779
+8.779
0.0%
jan 1, 2006
8.77
-0.009
-0.1%
jan 1, 2007
9.79
+1.021
11.64%
jan 1, 2008
9.951
+0.161
1.64%
jan 1, 2009
10.481
+0.53
5.32%
jan 1, 2010
10.787
+0.306
2.92%
jan 1, 2011
10.771
-0.015
-0.14%
jan 1, 2012
10.914
+0.142
1.32%
jan 1, 2013
10.974
+0.061
0.55%
jan 1, 2014
10.322
-0.652
-5.94%
jan 1, 2015
14.531
+4.209
40.77%
jan 1, 2016
14.614
+0.083
0.57%
Ranking of countries by current statistics by years