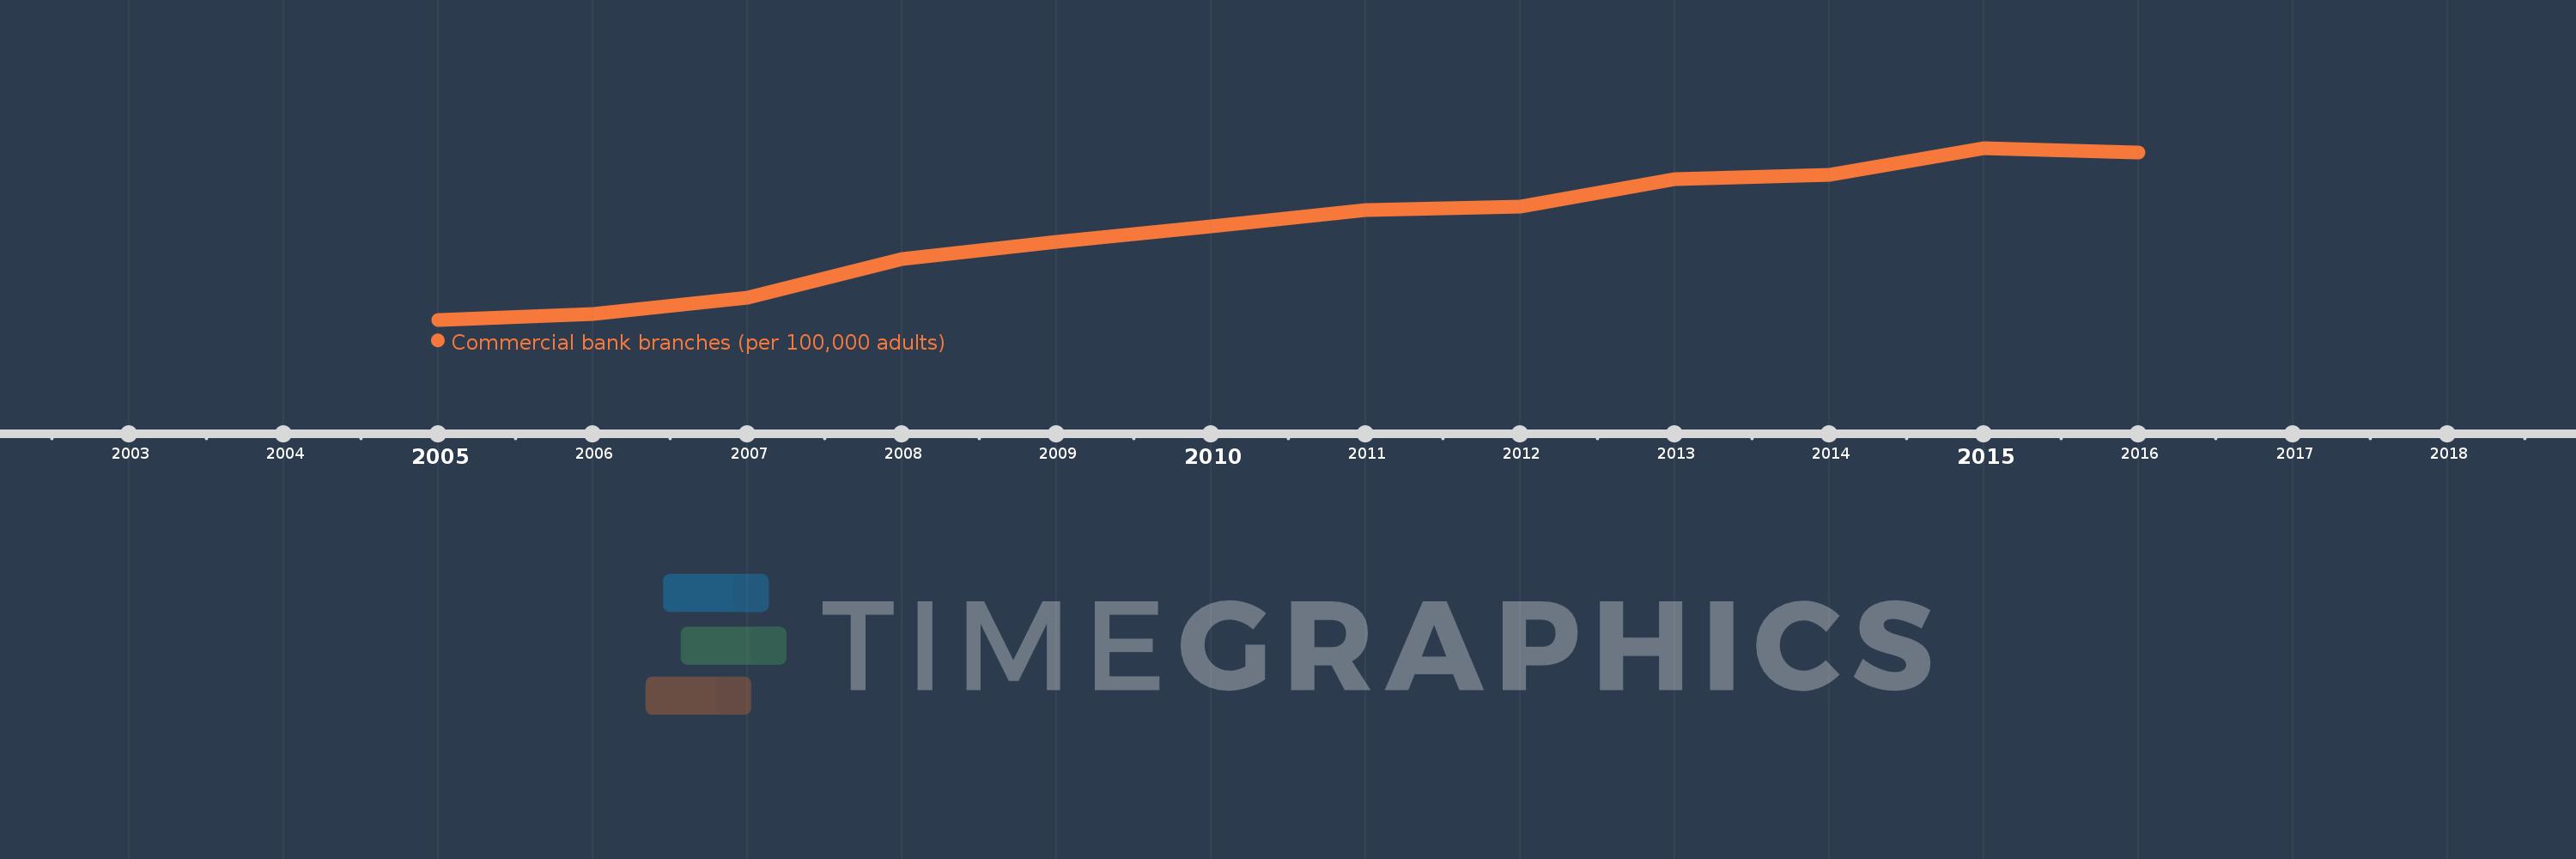
This timeline shows a graph from 2005 to 2016 of Least developed countries: UN classification. No data until 2004. Number of actual observations by date: 12.
Source name:
World Development Indicators
Source organization:
International Monetary Fund, Financial Access Survey.
Categories, topics:
Financial Sector
Last updated:
apr 23, 2017
Indicators value changes by year
Meaning:
2.346
Minimum:
1.226
jan 1, 2005
Maximum:
3.31
jan 1, 2015
At the date of observation
Value
Absolute change
Change from the previous value
jan 1, 2005
1.226
+1.226
0.0%
jan 1, 2006
1.295
+0.069
5.59%
jan 1, 2007
1.496
+0.201
15.52%
jan 1, 2008
1.958
+0.462
30.87%
jan 1, 2009
2.173
+0.216
11.01%
jan 1, 2010
2.359
+0.185
8.53%
jan 1, 2011
2.56
+0.201
8.53%
jan 1, 2012
2.597
+0.038
1.47%
jan 1, 2013
2.931
+0.334
12.85%
jan 1, 2014
2.988
+0.057
1.96%
jan 1, 2015
3.31
+0.321
10.74%
jan 1, 2016
3.258
-0.052
-1.57%
Ranking of countries by current statistics by years